Start New Query
Can near-infrared energy reach the brain for treatment of TBI? - Video abstract [78182]
Larry D. Morries, Theodore A. Henderson MD, PhD - 2015 (Video) 4323
This research was done under the supervision of NASA and seems to be some of the most independent research comparing therapy laser parameters.
View Resource
This video was created to support their published research. The authors did research using several lasers and slices of a sheep’s brain to try and determine the best parameter for treating TBI (Traumatic Brain Injury) with a desired fluency of 0.9 to 15 joules/cm2 at a depth of 2 cm. They state that getting the energy through the skull is especially difficult so they test multiple options so test the transfer rate. They started out using a continuous output split 980/810nm system (the only company that makes that type of split system, 80% of the power at 980nm and 20% of the power at 810nm, is LiteCure with their LightForce series). The result was less than 1/2% of the energy reached a depth of 2cm. Then they switched to pulsing and got an increase in the energy transfer. When they switched to a 810nm-only 15 watt system with pulsing the transfer rate increased to 16% of the output energy reached the target depth.
Here are some rough numbers to review the feasibility of using this system for treatment. If the duty cycle is 70%, the system will deliver 1.68 joules per second at a depth 2cm (15wattS*70%*16%). To get 5 joules/cm2 over 15 x 15 cm treatment area would require a total of 1125 joules at depth. This would take 23 minutes.
This research shows that only class 4 systems can delivery the level of power needed for this kind of therapy in a typical rushed doctor's office. A class 3b system with 1 watt would take 4 - 5 hours per treatment to get the same dosage.
The original research publication is titled " Treatments for traumatic brain injury with emphasis on transcranial near-infrared laser phototherapy"
video length: (9:18)
Original Source: https://www.youtube.com/watch?v=iZbP2IVekh0
Effect of autologous mesenchymal stem cells induced by low level laser therapy on cardiogenesis in the infarcted area following myocardial infarction in rats
Hana Tuby1, Tali Yaakobi1, Lidya Maltz1, Yaakov Delarea2, Orit Sagi-Assif2, Uri Oron1* - (Publication) 4467
This study showed rats that were give a heart attack and then treated with the laser on their shins saw a 55% reduction in infarction size in the heart showing that the stem cells released from the bone migrated to the heart.
View Resource
1Department of Zoology, The George S. Wise Faculty of Life Sciences, Tel-Aviv University, Tel-Aviv, Israel
2Department of Cell Biology and Immunology, The George S. Wise Faculty of Life Sciences, Tel-Aviv University, Tel-Aviv, Israel
Email: *oronu@post.tau.ac.il
Received 27 May 2013; revised 29 June 2013; accepted 16 July 2013
ABSTRACT
In this study, we investigated the hypothesis that photo- biostimulation by low-energy laser therapy (LLLT) applied to the bone marrow (BM) of myocardial in- farcted rats may attenuate the scarring processes that follow myocardial infarction (MI). Wistar rats under- went experimental MI. LLLT (Ga-Al-As diode laser) was applied to the BM of the exposed tibia at differ- ent time intervals post-MI (4 hrs, 48 hrs and 5 days). Sham-operated infarcted rats served as control. In- farct size was significantly reduced (55%) in the la- ser-treated rats as compared to the control non-treat- ed rats, at 2 weeks post-MI. A significant 3-fold in- crease was observed in the density of desmin immu- nopositive stained cells 14 days post-MI in the infarc- ted area of the laser-treated rats as compared to the non-laser-treated controls. The electron microscopy from the control infarcted rat hearts revealed a typi- cal interphase area between the intact myocardium and the infarcted area, with conspicuous fibroblasts with collagen deposition dispersed among them. In rats that were laser treated (to BM), the interphase zone demonstrated cells with different intracellular struc- tures. There was also a significant increase in the per- centage of c-kit positive cells and macrophages in the circulating blood of the laser treated rats as compar- ed to control non treated ones. In the majority of the cells clusters of myofibrils anchored to well-developed Z-lines and structures resembling the morphological characteristics of mature intact cardiomyocytes were evident. In conclusion, LLLT to the BM of rats post- MI induces cardiogenesis mainly at the borders of the infarcted area in the heart.
Keywords: Low-Level Laser Therapy; Myocardial Infarction; Macrophage; Desmin; Ultrastructure; c-Kit Positive Cells
1. INTRODUCTION
Regenerative capacity and mitotic activity in the heart are confined mainly to the lower vertebrates [1]. Amputation of ~20% of the zebrafish’s ventricular myocardium re- sulted in full regeneration without scarring [2]. In am- phibians, heart injury was associated with increased cell proliferation of myocytes and enhanced regeneration [3]. The adult mammalian heart was traditionally considered to be a post-mitotic organ with terminally differentiated cardiac myocytes. However, this dogma has recently been challenged by several studies and reviews [4-8]. These studies have suggested that cardiac myocytes are replaced throughout the lifespan even in the human heart, and that myocytes can regenerate from resident cardiac progenitor cells (CPC) as well as from bone marrow (BM). Studies in human infarcted hearts have shown evidence of cytoki- nesis of cells in the heart and evidence of cardiac stem cells that are activated in response to ischemic injury. This growth response is attenuated in chronic heart fail- ure [9]. Some studies have reported that cardiac myocyt- es can be derived from BM; specifically, side population precursor cells following induction of myocardial infarc- tion (MI) by left anterior descending artery (LAD) liga- tion [10-12]. Contradicting these findings, other laborato- ries using genetic markers have reported that lineage ne- gative, c-kit+ BM cells did not differentiate into cardio- myocytes [13]. It was also suggested that BM-derived stem cells may stimulate the small population of stem cells in the ischemic heart to proliferate and differentiate to enhance cardiac repair post-MI [14]. In a recent study transient regenerative potential in the mouse heart was demonstrated during the neonatal period [15].
Low-level laser therapy (LLLT) has been found to modulate various biological processes [16,17], such as increasing mitochondrial respiration and ATP synthesis [18], facilitating wound healing and promoting the proc- ess of skeletal muscle regeneration and angiogenesis [19- 21]. In an experimental model of the infarcted heart in rats and dogs, it was demonstrated that LLLT application directly to the infarcted area in the heart at optimal power parameters significantly reduced scar tissue formation [22-24]. This phenomenon was partially attributed to a significant elevation in ATP content, heat shock proteins, vascular endothelial growth factor (VEGF), inducible ni- tric oxide (NO) synthase, and angiogenesis in the ischemic zone of the laser-irradiated rats, as compared to non- irradiated rats [25].
The effect of photobiostimulation on stem cells or pro- genitor cells has not been extensively studied. LLLT ap- plication to normal human neural progenitor cells signi- ficantly increases ATP production in these cells [26]. LLLT delivery to MSCs and cardiac stem cells in vitro caused a significant enhancement in their proliferation rate [27,28]. LLLT has also been shown to increase the proliferation rate of adipose-derived stem cells in vitro [29]. Recently, we demonstrated that LLLT application to autologous BM could induce mesenchymal stem cells (MSCs) in the BM to proliferate and cause their recruit- ment and specific homing in on the infarcted rat heart and not on other organs [30,31]. The laser treatment to the BM also caused a marked and statistically significant reduction of 79% in the scarring and ventricular dilata- tion followed MI as compared to infarcted non-laser- treated rats. The aim of the present study was to investi- gate the possibility that induction of stem cells in the BM of rats by LLLT could also affect cardiogenesis in the in- farcted rat heart.
2. MATERIALS AND METHODS
2.1. Experimental Procedures
A total of 21 Wistar male rats, weighing 200 - 250 gr, that underwent ligation of the LAD artery to induce MI, were used as described by us previously [23]. All the ex- perimental procedures were approved by the animal care committee of Tel-Aviv University. Briefly, rats were anes- thetized with Avertin (1 ml/100 g body weight I.P.) and the lungs were ventilated. Thoractomy was performed by invasion of the intercostals muscles between the 5th and 6th rib to expose the heart. The LAD artery was occluded 2 mm from the origin with 5-0 polypropylene thread (Ethicon Inc., Cincinnati, OH). Following LAD artery occlusion the chest muscles and skin were sutured and the rats were ventilated until they woke up. The infarcted rats were divided randomly into two groups. In one group LLLT was applied directly to the BM 4 hrs, 48 hrs and 5 days post-MI (see below). The second group was non-laser-treated (the rat’s bone was exposed for the same duration as the laser-treated group but the laser was not turned on). Food and water were supplied ad libitum. Rats were sacrificed 14 days post-MI.
2.2. Laser Application
After induction of MI rats were randomly assigned to a laser-treated or control non-laser-treated group. A diode (Ga-Al-As) laser, wavelength 804 nm with a tunable po- wer output of maximum of 400 mW (Lasotronic Inc., Zug, Switzerland) for application to the BM was used. The laser device was equipped with a metal-backed glass fiber optic (1.5 mm diameter). An infrared viewer (Laso- tronic Inc. Zug, Switzerland) and infrared-sensitive de-tecting card (Newport, Inc., Irvine, CA) were used to de- termine the infrared irradiation area. Laser application was done by a 10 mm longitudinal cut in the skin above the medial aspect, and further delicate cleaning of the bone surface was carried out. The tip of the fiber optic (1.5 mm diameter) was placed perpendicularly to the center of the exposed medial aspect of the tibia and power den- sity of 10 mW/cm2 was applied to the BM. The laser was applied for a duration of 100 sec (energy density 1.0 J/cm2). Left or right exposed tibias were chosen at random for LLLT application. In sham-operated infarcted rats that served as control the tibias were exposed and the fi- ber optic was placed as described above but the laser beam was not turned on.
2.3. Histology and Electron Microscopy
A defined cross-section sample (2 mm thick) from the central part of the infarcted area was taken from all hearts for histology. Eight micron paraffin sections were pre- pared from the tissue samples of each heart. Infarct size was determined using Masson’s trichrome staining as described by us previously [23]. Three observers, blinded to control or laser-treated rats, analyzed infarct size. Six microscopic slides from the infarcted area of each heart were chosen at random for determination of infarct size. Infarct size was expressed as the percentage of the total infarcted area relative to the total area of the left ventri- cle (LV) in each section, using image analysis software Sigma Scan Pro (Sigma, St. Louis, MO).
For electron microscopy three tissue samples from each of the control and laser-irradiated rat hearts were taken from the interphase zone between the infarcted and non-infarcted tissue by macroscopic examination. Fixa- tion was performed in 3.5% glutaraldehyde in 0.1 M ca- codylate buffer for 24 hrs followed by embedment in Epon-812. Semi-thin sections (1 micron) were prepared in order to localize the interphase zone. Thin sections were then prepared and stained with uranyl acetate and lead citrate followed by examination with a Jeol electron microscope.
2.4. Immunohistochemistry
The total number of cells immunostained for desmin (bone marrow cells or newly formed) in the infarcted area were determined using a desmin kit (Zytomed Laboratory, Ber- lin, Germany). The procedure was performed at room temperature with anti-mouse (dilution 1:25 - 1:50) primary antibody for 60 min. Following washing, slides were in- cubated with HRP secondary antibody for mouse for 30 min followed by DAB Chromogen system (Covance Inc., Dedham). Slides were rinsed again in wash buffer, stain- ed in Hematoxylin for nuclei detection, mounted and viewed using a Zeiss microscope equipped with a camera and video screen. The total number of desmin immuno- stained cells within the infarcted area was counted and their density expressed as the percentage of the total area of the infarct using SigmaPro software.
2.5. Flow Cytometry Analysis
Blood samples were taken 2 and 7 days post-IR injury for fluorescence-activated cell sorting (FACS) analysis. 100 μl of blood were mixed with different antibodies: anti-mouse CD117 (c-kit) PE (eBioscience San Diego, USA) and rat IgG2b isotype control PE (eBioscience San Diego, USA) and anti-rat macrophage marker PE (eBio- science San Diego, USA) and mouse IgG2a K isotype control PE (eBioscience San Diego, USA), were used for the FACS analysis according to the manufacturer’s guide- lines. Forty five min post incubation of the whole fresh blood with the relevant antibodies, 2 ml of Fix/Lyse so- lution (eBioscience, San Diego, USA) was added. After mixture the suspended cells were left for 60 min in the dark at room temperature. Centrifugation was performed for 10 min, supernatant was removed and washing of the pellet was performed with 2 ml of Flow Cytometry Stain- ing Buffer Solution (eBioscience, San Diego, California, USA). After another centrifugation for 10 minutes the supernatant was decanted. The pellet containing mono- nucleated cells was resuspended in 200 μl of flow stain buffer for FACS analysis.
2.6. Statistical Analysis
The SigmaStat 2.0 (Sigma, St. Luis, USA) software was used for statistical analysis. Tests were performed first for normality distribution, followed by parametric (stu- dent’s t-test) test.
3. RESULTS
Application of LLLT to the infarcted heart caused a sig- nificant (p = 0.049) reduction of 55% in infarct size as compared to control. The present of macrophages and c- kit positive cells in the blood was determined by FACS analysis (Figure 1). It was found that at 5 days post MI there was a statistical significant 2-fold higher concentra- tion of macrophages and significant 1.4-fold higher c-kit positive cells (mesenchymal cells) in the laser treated rats as compared to the infarcted non laser treated rats. Des- min immunostaining of histological sections of the in- farcted zone from laser-treated rats demonstrated a higher density of positively stained cells than in the non laser-treated ones (Figures 2-4). In the interphase zone, cells extending from the myocardium towards the in 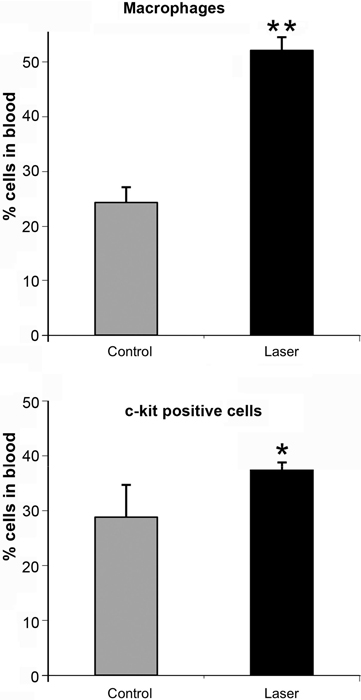
Figure 1. Percent (out of total mononucleated cells) of macro- phages and c-kit positive cells in blood of control and laser treated rats (to the bone marrow) 5 days post MI as revealed by FACS analysis. The results are mean ± S.E.M of 15 rats at each group. Statistical significance *p < 0.05; **p < 0.01.
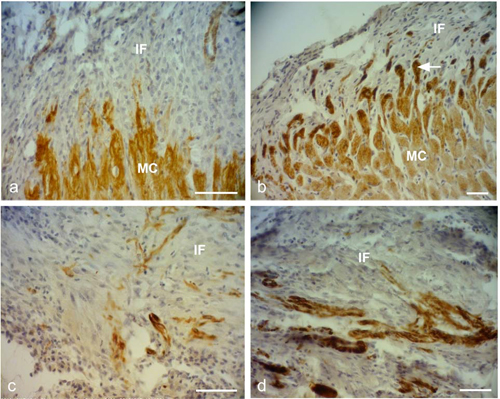
Figure 2. Representative desmin immunostained light micro- graphs of the infarcted zone of non-laser-treated rats (a, c) and laser-treated rats (to the bone marrow at 4 and 48 hrs and 5 days) (b, d) taken 2 weeks post-MI. Note that the zone in the control non-laser-treated rats contains mainly collageneous mate- rial with a few desmin immunopositive cells in the infarcted area (a, c); while in the laser-treated rats the zone displays posi- tive desmin staining in extended outgrowths (arrow) from the myocardium (MC) in (b), and in the cytoplasm of many cells in the infarcted area in (d). IF, Infarcted area. Bar = 50 μm.
farcted area showed higher immunostaining for desmin in the laser-treated rat hearts as compared to the control non-treated ones (Figure 2). The cell density of desmin immune-positive cells was also determined quantitatively in histological sections of both the infarcted laser-treated rats and infarcted non-laser-treated rats. The cell density was significantly (p < 0.01) 3-fold higher in the infarcted area of the laser-treated rats as compared to the non-la- ser-treated controls (Figure 4).
The electron micrographs of all samples taken from the control non-laser-treated infarcted rat hearts revealed a typical interphase area between intact and infarcted heart (Figure 5(a)). Adjacent to the non-ischemic intact myocardium there were conspicuous fibroblasts with col- lagen deposition dispersed among them (Figure 5(a)). In all samples taken from the laser-irradiated hearts the in- terphase zone between intact and infarcted area demon- strated different characteristics to those of the non-laser- treated infarcted rat hearts. Cells with newly-formed or- ganized contractile myofilaments dispersed in the cyto- plasm were detected in groups of several cells (Figure 5(b)). In these cells numerous mitochondria, clusters of ribosomes, and conspicuous clusters of contractile pro- teins were evident in the cytoplasm (Figures 6-8). Some cells contained dispersed contractile myofilaments in the cytoplasm that were still in an early stage of organization (Figure 6). The organization of newly-formed contractile myofilaments in the cytoplasm was observed in various
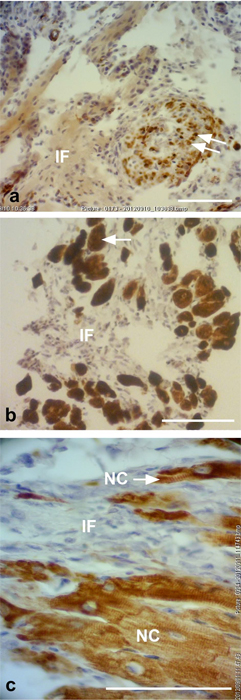
Figure 3. Representative desmin immunostained light micro- graphs of the interphase of the infarcted zone of laser-treated rats. Note that desmin positively stained cross-sections of myo- fibers (arrows) intermingled in the infarcted zone in (a). In (b) immunopositively stained cross-sections of myofibers (arrow) are visible in the infarcted area (IF). In (c) newly-formed car- diomyocytes (NC) are seen, with the desmin immunostaining mainly confined to the Z-line. Bar = 50 μm.
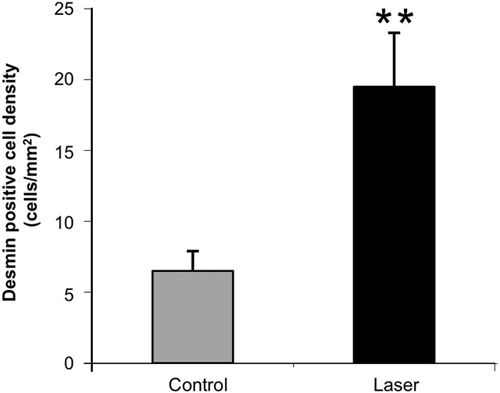
Figure 4. Density of desmin positively stained area (relative to total area) in the infarcted areas of control (non-laser-treated) and laser-treated (to the bone marrow) rats at 14 days post-MI. Results are mean+ S.E.M from 6 - 8 rats in each group. **p < 0.01.
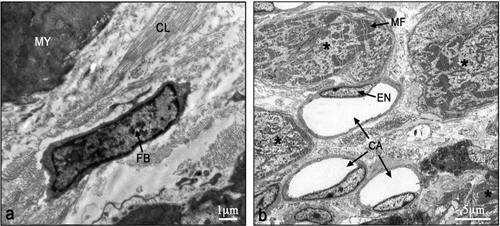
Figure 5. Electron micrographs of typical interphase zone be- tween myocardium and infarcted area of control non-laser- treated (a) and laser-treated (b) to bone marrow rats. Note intact myocardium (MY) and adjacent fibroblast (FB) in the infarcted area surrounded by collagen (CL) deposition in (a). In (b) sev- eral newly-formed cardiomyocytes (marked with asterix) with conspicuous well-organized myofilaments (MF) in their cyto- plasm are evident adjacent to blood capillaries (CA). EN, En- dothelial cell.
degrees of maturation in those cells. In some cells the myofilaments were dispersed in the cytoplasm and in others they were organized in clusters anchored to well- developed Z-lines (Figure 7(a)). In certain cells the myo- filaments were organized parallel to the longitudinal di- rection of the cells, resembling the morphological char- acteristics of mature intact cardiomyocytes (Figure 7(b)). Some of the cells were also seen in a process of forma- tion of typical intercalated disc between them (Figure 9).
4. DISCUSSION AND CONCLUSION
The most significant outcome of this study was the ap- pearance of newly-formed cardiomyocytes following laser treatment to the BM, as indicated by light and electron microscopy. There was a 3-fold increase in the density of
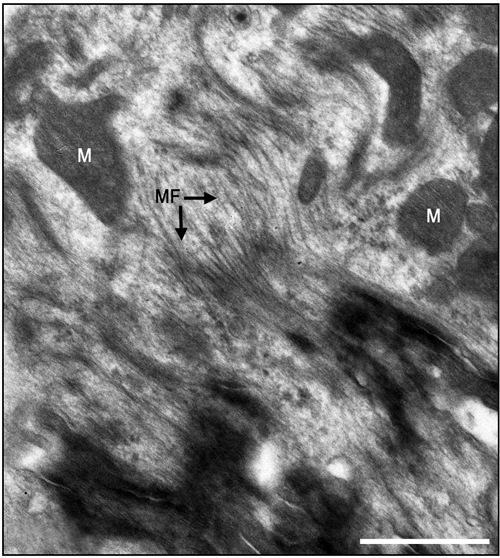
Figure 6. Electron micrographs of most probably newly-formed cardiomyocytes at an early stage of organization of contractile myofilaments. Note myofilaments (MF) in the cytoplasm. M, Mitochondrion. Bar = 1 μm.
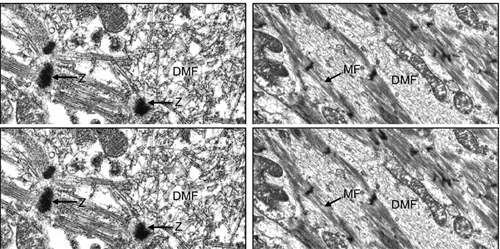
Figure 7. Electron micrographs of most probably newly-formed cardiomyocytes with early (a) and late (b) stages of the organi- zation of the contractile myofilaments in the cytoplasm. Note contractile myofilaments that are dispersed (DMF) in the cyto- plasm with a few organized in clusters anchored to Z-lines (Z) in (a). In (b) myofilaments (MF) are organized in parallel to the longitudinal axis of the cardiomyocyte, resembling their orga- nization in mature cardiomyocyte. N, Nucleus. Bar = 1 μm.
desmin immunostained cells in the infarcted rat hearts that had been laser treated. Desmin is a protein found in the cytoplasm of developing myocytes and cardiomyo- cytes [32]. The significantly higher occurrence of des- min-positive cells in the infarcted area of the laser- treated hearts may indicate the synthesis of new contrac- tile proteins in the developing new cardiomyocytes, re- sembling the process that takes place during embryonic development. The ultrastructural features of the cells in the interphase between the intact myocardium and the
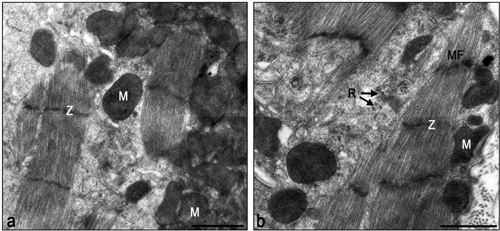
Figure 8. Electron micrographs of typical interphase zone be- tween myocardium and infarcted area of laser-treated infarcted rat heart. Note numerous mitochondria (M) in the cytoplasm of the cardiomyocytes in (a) and (b). Also note organized contrac- tile myofilament with well-developed Z-lines (Z), some dis- persed myofilaments and clusters of ribosomes (R). Bar = 1 μm.
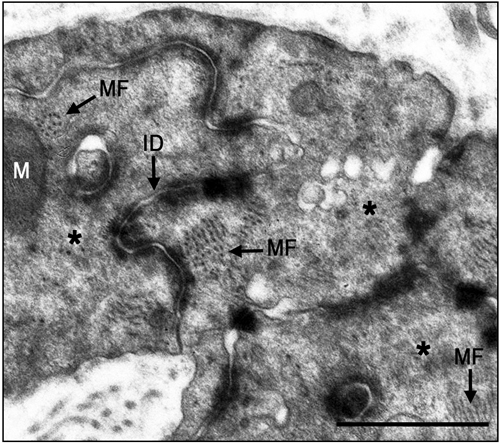
Figure 9. Electron micrographs of typical intercalated disk formation in the interphase region of the infarcted heart of la- ser-treated rats. Formation of intercalated disks (ID) between cells (marked with asterix) is evident. Note that the most proba- bly newly-formed cardiomyocytes contain clusters of myofila- ments (MF) in the cytoplasm that are conspicuous in their obli- que or cross-sections (arrows). Bar = 1 μm.
infarcted myocardium of the laser-treated rats, as shown in this study, clearly resemble the characteristics of car- diomyocytes during embryonic development of the heart [33]. Furthermore, the clusters of ribosomes and the nu- merous clusters of mitochondria in the cytoplasm of these cells may characterize cells that are active in the synthe- sis of proteins. It was previously demonstrated that direct LLLT to the infarcted hearts of rats, dogs and pigs caus- ed a significant reduction of scarring post-MI [23,24]. It was suggested that part of this reduction could be ex- plained by the regenerative response that takes place in the interphase zone [24].
The results of the present study indicate that the LLLT
applied to autologous BM attenuates the concentration of macrophages and MSC in the circulating blood. We have previously shown that LLLT application to the BM of infarcted rats caused a 2 fold enhancement in the rate of proliferation of MSC in the BM [30]. Those cells that most probably leave the BM to the circulating blood in- deed show a significant elevation of their concentration (as reveled by the FACS analysis in the present paper) at 5 days post MI. Consequently these cells probably home in on the infarcted heart, and even migrate specifically to the infarcted area [30]. These cells may induce cardiac stem cells to differentiate to newly-formed cardiomyo- cytes, as suggested previously by Hatzistergos et al. [14]. Indeed, it was found that endogenous c-kit+ cardiac stem cells were increased by 20-fold in the rat infarcted heart compared to control, following transcardial injection of BM-derived MSCs [14]. Such induction may be enabled due to paracrine secretion of various growth factors by the laser-stimulated MSC that originated from the BM. The possibility that paracrine secretion occurs in im- planted stem cells during cell therapy to the heart post- MI has been suggested previously [34]. Another mecha- nism that may take place after homing of stem cells to the infarcted heart of the laser-stimulated rats is that these cells continue to proliferate in the appropriate mi-lieu of the interphase zone in the infarcted heart and then differentiate to cardiomyocytes [30].
Another possible mechanism that maybe associates with the reduction of infarct size is the significant increase in the concentration of macrophages in the circulation fol- lowing LLLT to the BM as revealed from the FACS analysis in the present study. These findings corroborate with studies indicating that macrophages activity in the infarcted area at early stages post MI cause reduction of scarring post MI [35,36]. Thus, it could be postulated that more macrophages that will eventually home in the infarcted area from the circulating blood in the laser treated rats will also contribute to the reduction of scar- ring.
Although the findings of the present study do not in- dicate the extent of regenerative capacity of the rat in- farcted heart post-laser-irradiation, they do reveal a shift from practically no cardiomyocytes in the tissue samples taken from the non-laser-treated hearts, to the presence of newly-formed cardiomyocytes in all the electron mi- croscope sections taken from the hearts of rats that are laser-treated to the BM.
In conclusion, to the best of our knowledge, this is the first study to demonstrate the appearance of newly-form- ed cardiomyocytes in the infarcted area following LLLT to autologous BM in the infarcted rat heart. The mecha- nisms associated with this phenomenon remain to be elu- cidated in further studies.
5. ACKNOWLEDGEMENTS
This study was partially supported by the Elizabeth and Nicholas Shle- zak Super-center for Cardiac Research and Medical Engineering. The authors wish to acknowledge N. Paz for editing the manuscript and V. Wexler for helping with preparation of the figures.
REFERENCES
[1]
Rumyantsev, P.P. (1977) Interrelations of the prolifera- tion and differentiation processes during cardiac myoge- nesis and regeneration. International Review of Cytology, 51, 186-273. doi:10.1016/S0074-7696(08)60228-4
[2]
Poss, K.D., Wilson, L.G. and Keating, M.T. (2002) Heart regeneration in zebrafish. Science, 298, 2188-2190. doi:10.1126/science.1077857
[3]
Rumyantsev, P.P. (1973) Post-injury DNA synthesis, mi- tosis and ultrastructural reorganization of adult frog car- diac myocytes. An electron microscopic-autoradiographic study. Z Zellforsch Mikrosk Anat, 139, 431-50. doi:10.1007/BF00306596
[4]
Barnett, P. and van den Hoff, M.J.B. (2011) Cardiac re- generation: Different cells same goal. Medical & Biologi- cal Engineering & Computing, 49, 723-732. doi:10.1007/s11517-011-0776-5
[5]
Bollini, S., Smart. N. and Riley, P.R. (2011) Resident car- diac progenitor cells: At the heart of regeneration. Jour- nal of Molecular and Cellular Cardiology, 50, 296-303. doi:10.1016/j.yjmcc.2010.07.006
[6]
Choi, W.Y. and Poss, K.D. (2012) Cardiac regeneration. Current Topics in Developmental Biology, 100, 319-343. doi:10.1016/B978-0-12-387786-4.00010-5
[7]
Laflamme, M.A. and Murry, C.E. (2011) Heart regenera- tion. Nature, 473, 326-335. doi:10.1038/nature10147
[8]
Steinhauser, M.L. and Lee, R.T. (2011) Regeneration of the heart. EMBO Molecular Medicine, 3, 701-712. doi:10.1002/emmm.201100175
[9]
Urbanek, K., Torella, D., Sheikh, F., De Angelis, A., Nur- zynska, D., Silvestri, F., Beltrami, C.A., Bussani, R., Bel- trami, A.P., Quaini, F., Bolli, R., Leri, A., Kajstura. J. and Anversa, P. (2005) Myocardial regeneration by activation of multipotent cardiac stem cells in ischemic heart failure. Proceedings of the National Academy of Sciences of the USA, 102, 8692-8697. doi:10.1073/pnas.0500169102
[10]
Bittner, R.E., Schofer, C., Weipoltshammer, K., Ivanova, S., Streubel, B., Hauser, E., Freilinger, M., Höger, H., Elbe- Bürger, A. and Wachtler, F. (1999) Recruitment of bone- marrow-derived cells by skeletal and cardiac muscle in adult dystrophic mdx mice. Anatomy and Embryology, 199, 391-396. doi:10.1007/s004290050237
[11]
Jackson, K.A., Majka, S.M., Wand, H., Pocius, J., Hart- ley, C.J., Majesky, M.W., Entman, M.L., Michael, L.H., Hirschi, K.K. and Goodell, M.A. (2001) Regeneration of ischemic cardiac muscle and vascular endothelium by adult stem cells. The Journal of Clinical Investigation, 107, 1395-1402. doi:10.1172/JCI12150
[12]
Pfister, O., Mouquet, F., Jain, M., Summer, R., Helmes, M., Fine, A., Colucci, W.S. and Liao, R. (2005) CD3- but not CD31+ cardiac side population cells exhibit functio- nal cardiomyogenic differentiation. Circulation Research, 97, 52-61. doi:10.1161/01.RES.0000173297.53793.fa
[13]
Balsam, L.B., Wagers, A.J., Christensen, J.L., Kofidis, T., Weissman, I.L. and Robbins, R.C. (2004) Haematopoietic stem cells adopt mature haematopoietic fates in ischaemic myocardium. Nature, 428, 668-673. doi:10.1038/nature02460
[14]
Hatzistergos, K.E., Quevedo, H., Oskouei. B.N., Hu, Q., Feigenbaum, G.S., Margitich, I.S., Mazhari, R., Boyle, A.J., Zambrano, J.P., Rodriguez, J.E., Dulce, R., Pattany, P.M., Valdes, D., Revilla, C., Heldman, A.W., McNiece, I. and Hare, J.M. (2010) Bone marrow mesenchymal stem cells stimulate cardiac stem cell proliferation and differ- entiation. Circulation Research, 107, 913-922. doi:10.1161/CIRCRESAHA.110.222703
[15]
Porrello, E.R., Mahmoud, A.I., Simpson, E., Hill, J.A., Richardson, J.A., Olson, E.N. and Sadek, H.A. (2011) Transient regenerative potential of the neonatal mouse heart. Science, 331, 1078-1080. doi:10.1126/science.1200708
[16]
Conlan, M.J., Rapley, J.W. and Cobb, C.M. (1996) Bio- stimulation of wound healing by low energy laser irradia- tion. Journal of Clinical Periodontology, 23, 492-496. doi:10.1111/j.1600-051X.1996.tb00580.x
[17]
Karu, T. (2007) Ten lectures on basic science of laser photherapy. Prima Books, Gragesberg.
[18]
Karu, T. (2010) Mitochondrial mechanisms of photobio- modulation in context of new data about multiple roles of ATP. Photomedicine and Laser Surgery, 28, 159-160. doi:10.1089/pho.2010.2789
[19]
Bibikova, A. and Oron, U. (1993) Promotion of muscle regeneration in the toad (Bufo viridis) gastrocnemius mu- scle by low energy laser irradiation. Anatomical Record, 235, 374-380. doi:10.1002/ar.1092350306
[20]
Bibikova, A., Belkin, A. and Oron, U. (1994) Enhancement of angiogenesis in regenerating gastrocnemius muscle of the toad (Bufo viridis) by low energy laser irradiation. Anatomy and Embryology, 190, 597-602. doi:10.1007/BF00190110
[21]
Oron, U. (2006) Photoengineering of tissue repair in ske- letal and cardiac muscles. Photomedicine and Laser Sur- gery, 24, 111-120. doi:10.1089/pho.2006.24.111
[22]
Yaakobi, T., Shoshani, Y., Levkovitz, S., Rubin, O., Ben- Haim, S.A. and Oron, U. (2001) Long term effect of low energy laser irradiation on infarction and reperfusion in- jury in the rat heart. Journal of Applied Physiology, 90, 2411-2441.
[23]
Oron, U., Yaakobi, T., Oron, A., Hayam, G., Gepstein, L., Wolf, T., Rubin, O. and Ben Haim, S.A. (2001a) Attenu- ation of the formation of scar tissue in rats and dogs post myocardial infarction by low energy laser irradiation. La- sers in Surgery and Medicine, 28, 204-211. doi:10.1002/lsm.1039
[24]
Oron, U., Yaakobi, T., Oron, A., Mordechovitz, D., Shof- ti, R., Hayam, G., Dror, U., Gepstein, L., Wolf, T., Hau- denschild, C. and Ben Haim, S.A. (2001b) Low energy la- ser irradiation reduces formation of scar tissue following myocardial infarction in dogs. Circulation, 103, 296-301.doi:10.1161/01.CIR.103.2.296
[25]
Tuby, H., Maltz, L. and Oron, U. (2006) Modulations of VEGF and iNOS in the rat heart by low energy laser irra- diation are associated with cardioprotection and enhanced angiogenesis. Lasers in Surgery and Medicine, 38, 682- 688. doi:10.1002/lsm.20377
[26]
Oron, U., Ilic, S., De Taboada, L. and Streeter, J. (2007) Ga-As (808 nm) laser irradiation enhance ATP produc- tion in human neuronal cells in culture. Photomedicine and Laser Surgery, 25, 180-182. doi:10.1089/pho.2007.2064
[27]
Tuby, H., Maltz, L. and Oron, U. (2007) Low-level laser irradiation (LLLI) promotes proliferation of mesenchy- mal and cardiac stem cells in culture. Lasers in Surgery and Medicine, 39, 373-378. doi:10.1002/lsm.20492
[28]
Li, W.T., Leu, Y.C. and Wu, J.L. (2010) Red-light light- emitting diode irradiation increases the proliferation and osteogenic differentiation of rat bone marrow mesenchy- mal stem cells. Photomedicine and Laser Surgery, 28, S-157-S-165. doi:10.1089/pho.2009.2540
[29]
Mvula, B., Moore, T.J. and Abrahamse, H. (2010) Effect of low-level laser irradiation and epidermal growth factor on adult human adipose-derived stem cells. Lasers in Medical Science, 25, 33-39. doi:10.1007/s10103-008-0636-1
[30]
Tuby, H., Maltz, L. and Oron, U. (2011) Induction of au- tologous mesenchymal stem cells in the bone marrow by low-level laser therapy has profound beneficial effects on the infarcted rat heart. Lasers in Surgery and Medicine, 43, 401-409. doi:10.1002/lsm.21063
[31]
Oron, U. (2011) Light therapy and stem cells: A thera- peutic intervention of the future. Journal of Interventio- nal Cardiology, 3, 627-629.
[32]
Toma, C., Pittenger, M.F., Cahill, K.S., Byrne, B.J. and Kessler, P.D. (2002) Human mesenchymal stem cells dif- ferentiate to a cardiomyocyte phenotype in the adult mu- rine heart. Circulation, 105, 93-98. doi:10.1161/hc0102.101442
[33]
Oron, U. and Mandelberg, M. (1985) Focal regeneration in the rat myocardium following cold injury. Cell Tissue Research, 241, 459-463. doi:10.1007/BF00217194
[34]
Mummery, C.L., Davis, R.P. and Krieger, J.E. (2010) Challenges in using stem cells for cardiac repair. Science Translational Medicine, 14, 1-5.
[35]
van Amerongen, M.J., Harmsen, M.C., van Rooijen, N., Petersen, A.H. and van Luyn, M.J. (2007) Macrophage dep- letion impairs wound healing and increases left ventricu- lar remodeling after myocardial injury in mice. American Journal of Pathology, 170, 1093-1103. doi:10.2353/ajpath.2007.060547
[36]
Okazaki, T., Ebihara, S., Asada, M., Yamanda, S., Saijo, Y., Shiraishi, Y., Ebihara, T., Niu, K., Mei, H., Arai, H. and Yambe, T. (2007) Macrophage colony-stimulating factor improves cardiac function after ischemic injury by induc- ing vascular endothelial growth factor production and sur- vival of cardiomyocytes. American Journal of Pathology, 171, 1093-1103. doi:10.2353/ajpath.2007.061191
Original Source: http://www.scirp.org/journal/jbise
LLLT for Traumatic Brain Injury (TBI)
Michael Hamblin - 2013 (Video) 4322
Dr Hamblin is associated with Harvard and the Wellman center. He is a distinguished author and spokeman for all type of medical lasers but he is also associated with Thor.
View Resource
Dr. Hamblin discusses the use of low level laser therapy for all type of brain injuries. He is an expert in all type of light healing (see below). He has performed much of his research on rats. He claims several key points:
- 10 Hertz is the preferred pulsing frequency for the brain
- 810nm is the preferred wavelength for cell interaction.
- The best treatment period is about 7 sessions but less than 14 days of treatments. Going to longer term treatments seems to reduce the effectiveness.
This video is mainly about TBI but the principals are universal. Dr Hamblin is associated with Thor laser so there is some potential for bias but he is also assocated with Harvard and the Wellman Centre. Introduction to Low Level Laser Therapy (LLLT) for Traumatic Brain Injury (TBI) by Mike Hamblin. Wellman Centre for Photomedicine, Harvard Medical School.
video length: (6:18)
This video is restricted for minors.
Original Source: https://www.youtube.com/watch?v=sl5T1Lw0B5o
Dr Michael Hamblin: Harvard Professor and Infrared Therapy Expert
Dr. Michael Hamblin - 2015 (Video) 4336
Dr. Hamblin is a Harvard professor and has been studying the effects of LLLT for many years, but he is also associated with Thor.
View Resource
In this video Dr. Michael Hamblin is interviewed by youtuber Selfhacked. Dr. Hamblin discusses the use of red and near infrared light in low level light therapy, he talks about the different possibilities of LLLT as well as some of his personal experiences with LLLT. He explains the reasons behind some of the effects from LLLT noticed in patients over the years, including it's effect on calcium in cells, ion channels, and infrared light vs. ultraviolet light. Dr. Hamblin also notes the differences between LLLT, bright light therapy, and light from the sun that is used for theraputic purposes. The majority of the video is spent discussing the effect of LLLT on the brain specifically.
video length: (52:08)
Original Source: http://selfhacked.com/2015/07/18/interview-with-dr-michael-hamblin-harvard-professor-and-infrared-therapy-expert/
Dr. Juanita Anders Intro to PBM
Dr. Juanita Anders - (Video) 4516
This video is about a 1 hour video but it covers alot of details about PBM.
View Resource
This video features Dr. Juanita Anders who is a pioneer and expert in the field of PBM. This is a great overview of the science and concepts in PBM. While the talk does get pretty technical and involved in places, a full understanding of all of the biological mechanisms that Dr. Anders discusses isn't necessary to get a high level understanding of the science and benefits of light therapy.
Original Source: https://www.youtube.com/watch?v=0MMewRIP51M
The Science On Red Light Therapy Benefits w/ Dr. Michael Hamblin, Ph.D. and Ari Whitten
Dr. Michael Hamblin - Youtube (Video) 4517
This is a 1 and 1/2 hour interview with Dr Hamblin covers alot of details on PBM.
View Resource
This link is an audio interview with Dr. Michael Hamblin (an associate professor at Harvard Medical School) and is an informative podcast type of interview regarding the latest in PBM research.
Original Source: https://www.youtube.com/watch?v=D9oUlKpo1ek&t=6s
Near-infrared light increases ATP, extends lifespan and improves mobility in aged Drosophila melanogaster
Rana Begum 1 , Karin Calaza 2 , Jaimie Hoh Kam 1 , Thomas E. Salt 1 , Chris Hogg 3 and Glen Jeffery - Royal Society Publishing (Publication) 4509
PBM increased the average lifespan and mobility of fruit flies. Although they all died at 12 weeks, treating the flies with PBM significantly increase the average healthspan.
View Resource
Near-infrared light increases ATP, extends lifespan and improves mobility in aged Drosophila melanogaster Rana Begum 1 , Karin Calaza 2 , Jaimie Hoh Kam 1 , Thomas E. Salt 1 , Chris Hogg 3 and Glen Jeffery Institute of Ophthalmology, University College London, London EC1V 9EL, UK 2 Program of Neuroscience, Institute de Biologia, Universidade Federal Fluminense, Rio de Janeiro 24210130, Brazil 3 Moorfields Eye Hospital, London EC1V 2PD, UK Ageing is an irreversible cellular decline partly driven by failing mitochondrial integrity. Mitochondria accumulate DNA mutations and reduce ATP production necessary for cellular metabolism. This is associated with inflammation. Near-infrared exposure increases retinal ATP in old mice via cytochrome c oxidase absorption and reduces inflammation. Here, we expose fruitflies daily to 670 nm radiation, revealing elevated ATP and reduced inflam- mation with age. Critically, there was a significant increase in average lifespan: 100–175% more flies survived into old age following 670 nm exposure and these had significantly improved mobility. This may be a simple route to extending lifespan and improving function in old age. 1. Introduction Mitochondria provide cellular energy via adenosine triphosphate (ATP). But, their DNA (mtDNA) suffers from progressive mutations resulting in reduced ATP production, which is thought to run concomitantly with an increase in pro-inflammatory reactive oxygen species (ROS) [1,2]. Hence, hallmarks of ageing are reduced cellular energy and progressive systemic inflammation. Meta- bolic demand also plays a role as tissues and organisms with high metabolic rates generally suffer from rapid ageing [3,4]. The retina has the greatest metabolic demand in the body [5], but ATP decline in the central nervous system can be significantly improved by near-infrared/infrared light (NIR/IR, [6]). Specific wavelengths in this range are absorbed by cytochrome c oxidase in mitochondrial respiration, improving its efficiency [7–10]. These wavelengths improve mito- chondrial membrane potentials, significantly reduce inflammation and reduce macrophage numbers with brief exposures of around 60–90 s repeated over approximately a week [11,12]. NIR/IR also reduces experimental pathology when insult impacts on mitochondrial function, as in experimental Parkinson’s disease, where NIR significantly reduces cell death in the substantia nigra [13]. However, NIR/IR studies have largely used light for short periods and their impact on lifespan has not been assessed [7,11,12]. If NIR improves mitochondrial function we predict it may extend life. The fly has been used here because of its relatively short life [14]. Hence, we ask if long-term exposure to 670 nm in Drosophila melanogaster can increase lifespan and improve function in old age. 2. Material and methods Drosophila melanogaster were used. Hatched male flies were housed on 12/12 light cycle at 258C within a season. Half were exposed to 670 nm for 20 min per day at & 2015 The Authors. Published by the Royal Society under the terms of the Creative Commons Attribution License http://creativecommons.org/licenses/by/4.0/, which permits unrestricted use, provided the original author and source are credited. on March 18, 2015http://rsbl.royalsocietypublishing.org/Downloaded from 40 mW cm 22 in clear plastic 50 cm 3 (28 mm wide) containers, illuminating flies from either side, which were counted weekly. Room illumination was 2 mW cm 22 . 670 nm energies were approximately 100 times lower than indirect sunlight, consistent with earlier studies [7]. Light devices were built by C. H. Elec- tronics UK and contained 50 670 nm LEDS over 20 cm 2 . Six independent replicates were used in lifespan experiments (n ¼ 620 flies). ATP, inflammation and mobility were assessed at seven weeks, when ATP and mobility are known to decline [15]. ATP was measured by luciferin–luciferase assay (Enliten w ATP Assay System, Promega). Flies were killed with liquid nitrogen, transferred to 2.5% trichoroacetic acid (TCA), then homogenized at 48C. Supernatant was collected and the TCA was neutralized with 1 M Tris–acetate buffer (pH 7.75, final TCA concentration 0.0625%); 10 ml of neutralized solution was added to 100 ml of luci- ferin–luciferase in fresh buffer. ATP was measured using an Orion microplate luminometer (Berthold Detection Systems GmbH) and data normalized to fly numbers. Tissues were homogenized in 2% sodium dodecyl sulfate (SDS) with protease inhibitor cocktail for Western blot (Roche Diagnos- tics), and centrifuged; the supernatant was pipetted out, separated with 10% SDS–PAGE and electrophoretically transferred onto nylon membranes. Immunoblotting was undertaken for complement component C3 (Cappel, MP Biomedicals), which is highly conserved [16]. Protein was quantified by densitometric X-ray scanning and values were normalized to a-tubulin. Fly mobility assessment was as Bjedov et al. [14]. Flies were placed in 100 ml clear cylinders (seven flies per trial), tapped to the bottom and then videoed, the last two steps repeated three times. Using the videos, the number of flies above the 50 ml mark (9 cm from the bottom) was counted after 1 min. Individual flies were traced, with absolute distance travelled measured. Data w er e analysed with GraphPad P RISM v. 5 and sta t is ti cal analysis was undertaken using Mann –Whitne y U non-parametric and log-rank tests. 3. Results (a) ATP levels are elevated and systemic inflammation reduced Whole body ATP declines with age only after appr o xima tely seven weeks [14], when ATP was measured here. A TP concen- trations wer e significantly grea t er, by approxima tely 80%, in 670 nm exposed animals compared with unexposed (figure 1a, Mann–Whitney test p ¼ 0.028). At seven weeks, W estern blots wer e undertaken for inflammatory marker complement com- ponent C3. This was reduced in 670 nm exposed flies compared with controls (figure 1b). Hence, 670 nm radiation elevates ATP and reduces inflammation. (b) Lifespan increases Fly numbers in experimental and control groups were similar in the two weeks post-hatching. From week 3, fly deaths were greater in controls than 670 nm exposed flies and they remained so at each time point until week 11–12, when all flies were dead in both groups. This difference was significant (figure 2, log-rank test p ¼ 0.008). The progressive mean percentage increase in 670 nm flies alive over controls is given in figure 2b. Group differences accelerated from week 4, when 10% extra 670 nm treated flies were alive compared with controls, to approximately 50% extra when the control population had halved. By the time the control population was reduced by 80%, at week 8, more than 100% extra 670 nm treated flies remained alive. Subsequently, group differences reached almost 180% before declining to zero in both groups at week 11–12. Hence, 670 nm did not extend absolute lifespan. (c) Aged mobility increases Mobility of 670 nm treated and control flies was measured at seven weeks. Significantly more 670 nm treated flies climbed above the 50 ml level (9 cm) and significantly more travelled a greater distance than controls (Mann–Whitney test p ¼ 0.028, p ¼ 0.014, respectively). Twice as many 670 nm flies climbed above 50 ml (9 cm) compared with controls and these travelled twice the distance in 1 min compared with controls (figure 2c,d). Hence, 670 nm exposure significantly improves both lifespan and mobility. 4. Discussion Drosophila melanogaster has been widely used in lifespan studies as they are short lived and their genomic sequence is relatively well understood [14,17], hence their adoption experimentally here to extend lifespan. Our results reveal [ATP] (nM)/fly ATP level(a) C3 expression (Western blot)(b) control absolute intensity 670 control 670 control C3 ~ 110 kDa a-tubulin 55 kDa 670 * 0 0 500 1000 200 400 600 Figure 1. Exposur e to 670 nm radiation increases ATP in aged flies and reduces inflammati on. (a) Sev en week old flies exposed to 670 nm had a significant incr ease in whole body ATP compared with controls, p ¼ 0.028. n ¼ 25 flies per group. (b) Whole body inflammation (C3) was measured in seven week flies using W estern blot. This was reduced in 670 nm exposed flies by approxima tely 15%. Here, flies were pooled within groups as C3 protein levels were lo w in individuals. Hence there are no error bars. n ¼ 15 flies per group. (Online version in colour.) rsbl.royalsocietypublishing.org Biol. Lett. 11: 20150073 2 on March 18, 2015http://rsbl.royalsocietypublishing.org/Downloaded from that when flies are exposed to 670 nm radiation they have reduced inflammation, improved ATP, improved mobility and extended average lifespans. These data are consistent with the majority of studies undertaken using 670 nm on mammals, showing reduced inflammation in experimental models and in ageing, and improved ATP levels [6,7]. How- ever, it would be difficult to undertake lifespan experiments in mice as the light would not penetrate the entire body as it does in flies and hence its influence would not be systemic. There are many factors and pathways in ageing, and nine candidate hallmarks have been suggested, which may be separate, but also are likely to have interactions [1]. Mito- chondrial function is one. Previously, mitochondrial function and ageing were viewed within a framework of pro- gressive mtDNA mutations/deletions resulting in reduced ATP and increased ROS. The balance of these factors was seen as a driver in the mitochondrial theory of ageing [18]. However, evidence has undermined the role of ROS in ageing [19,20]. Hence, some mutant mice have reduced life- span as a result of mtDNA mutations/deletions not associated with increased ROS [21,22]. Further, increased ROS can prolong lifespan in yeast and Caenorhabditis elegans [22,23], and in mammals it does not accelerate ageing [20]. These data are reviewed by Lopez-Otin et al. [1], who argue that low ROS may activate compensatory mechanisms and not directly contribute to ageing. Such data may undermine the ROS element in Harman’s mitochondrial theory [18]. If correct, it places greater potential emphasis on ATP in ageing. NIR has been successful in treating induced pathology [7] and ageing, particularly in the retina, where progressive age- related inflammation is marked owing to high metabolic rate [11,12]. These wavelengths penetrate deeply and 670 nm trans-illuminated our flies at 40 mW cm 22 . In relation to this, it may be significant that, while old domestic incandescent light- ing contained significant NIR elements, none is present in modern strip lighting or energy-saving domestic lighting [12]. The absence of these wavelengths from artificial lighting may have long-term consequences. As longer wavelengths penetrate deeply, this may be of significance not only for the ageing eye, but also potentially for other tissues. Ethics statement. Fly research is free of legal ethical constraint. Data accessibility. All data are presented in the manuscript. Acknowledgement. We thank Iris Salecker, Giovanna Vinti and Tobi Weinrrich for technical assistance. Author contributions. G.J. designed experiments and wrote the manu- script. All authors undertook the experiments and approved the final version of the manuscript. R.B. analysed the data. Funding statement. Supported by the Rosetrees Trust UK. K.C. was a research fellow from CAPES Brazil (proc. 18134/12-2). Competing interests. We have no competing interests. References 1. Lopez-Otin C, Blasco MA, Partridge L, Serrano M, Kroemer G. 2013 The hallmarks of aging. Cell 153, 1194–1217. (doi:10.1016/ j.cell.2013.05.039) 2. Balaban RS, Nemoto S, Finkel T. 2005 Mitochondrial, oxidants and aging. Cell 120, 483–495. (doi:10.1016/j.cell.2005.02.001) 3. Speakman JR. 2005 Body size, energy, metabolism and lifespan. J. Exp. Biol. 208, 1717–1730. (doi:10. 1242/jeb.01556) 4. Wang Z, Ying Z, Bosy-Westphal A, Zhang J, Schautz B, Later W, Heymsfield SB, Mu¨ller MJ. 2010 Specific metabolic rates of major organs and tissues across adulthood: evolution by mechanistic model of resting expenditure. Am. J. Clin. Nutr. 92, 1369– 1377. (doi:10.3945/ajcn.2010.29885) 5. Yu DY, Cringle SJ. 2001 Oxygen distribution and consumption within the retina in vascularized and avascular retinas and in animal models of disease. Prog. Retin. Eye Res. 20, 175–208. (doi:10.1016/ S1350-9462(00)00027-6) 0 0 10 20 30 40 50 60 70 80 100 (a) (c) (d ) (b) % survival over controls n = 620 flies fly survival curves for 670 nm (–) and control (–) 90 123456 time (weeks) % survival 78910 0 0 100 200 300 123456 no. weeks % increase over control control distance travelled in 1 min 670 control 670 * 0 20 60 40 80 100 distance (mm) fly climbing (>90 mm) * 0 20 60 40 80 % >90 mm in 1 min 78910 11 12 Figure 2. Lifespan and mobility. (a) Fly numbers at progressive weeks in groups exposed to 670 nm supplemented light each day (red line) and controls (black line). Curves are averages for six independent experiments with a minimum of 40 flies per group in each experiment. Fly death rates separated between three and six weeks with fewer flies dying in 670 nm exposed animals. Reduction in the two population followed similar patterns from six weeks but with the 670 nm exposed group having greater numbers at any point until week 12. In all replicates, there was no indication that 670 nm increased absolute lifespan beyond weeks 11 – 12. Differences between the two groups were statistically significant ( p ¼ 0.008). (b) Inset: percentage increase of 670 nm exposed flies alive at pro- gressive weeks. (c) Seven week old 670 nm exposed flies were more active than controls. (d) Mobility measures the percentage of flies that climbed above 90 mm in a clear 100 ml cylinder. (d) This was filmed and then the distance travelled by each fly was measured in each group. In both cases, the 670 nm exposed flies where significantly more mobile. There were 21 flies in each group in each condition. (Online verion in colour.) rsbl.royalsocietypublishing.org Biol. Lett. 11: 20150073 3 on March 18, 2015http://rsbl.royalsocietypublishing.org/Downloaded from 6. Gkotsi D, Begum R, Salt T, Lascaratos G, Hogg C, Chau KY, Schapira AH, Jeffery G. 2014 Recharging mitochondrial batteries in old eyes. Near infra-red increases ATP. Exp. Eye Res. 122, 50 –53. (doi:10. 1016/j.exer.2014.02.023) 7. Fitzgerald M et al . 2013 Red/near-infrared irradiation therapy for treatment of central nervous system injuries and disorders. Rev. Neurosci. 24, 205–226. (doi:10.1515/revneuro-2012-0086) 8. Wilson M, Greenwood C. 1970 The long-wavelength absortion band of cytochrome c oxidase. Biochem. J. 116, 17 –18. 9. Karu TI, Pyatibrat LV, Kolyakov SF, Afanasyeva NI. 2005 Absorption measurements of cell monolayer relevant to phototherapy: reduction of cytochrome c oxidase under near IR radiation. J. Photochem. Photobiol. 81, 98– 106. (doi:10.1016/j.jphotobiol.2005.07.002) 10. Cooper CE, Springett R. 1997 Measurement of cytochrome oxidase and mitochondrial energetics by near-infrared spectroscopy. Phil. Trans. R. Soc. Lond. B 352, 669– 676. (doi:10.1098/rstb.1997.0048) 11. Kokkinopoulos I, Colman A, Hogg C, Heckenlively J, Jeffery G. 2013 Age-related inflammation is reduced by 670 nm light via increased mitochondrial membrane potential. Neurobiol. Aging 34, 602– 609. (doi:10.1016/j.neurobiolaging.2012.04.014) 12. Begum R, Powner MB, Hudson N, Hogg C, Jeffery G. 2013 Treatment with 670 nm up regulates cytochrome C oxidase expression and reduces inflammation in an age-related macular degeneration model. PLoS ONE 8, e57828. (doi:10. 1371/journal.pone.0057828) 13. Purushothuman S, Nandasena C, Johnstone DM, Stone J, Mitrofanis J. 2013 The impact of near- infrared light on dopaminergic cell survival in a transgenic mouse model of parkinsonism. Brain Res. 1535, 61 –70. (doi:10.1016/j.brainres.2013.08.047) 14. Bjedov I, Toivonen JM, Kerr F, Slack C, Foley A, Partridge L. 2010 Mechanisms of life span extension by rampamycin in the fruit fly Drosophila melanogaster. Cell Metab. 11, 35–46. (doi:10.1016/ j.cmet.2009.11.010) 15. Vernace VA, Arnaud L, Schmidt-Glenewinkel T, Figueiredo-Pereira ME. 2007 Aging perturbs 26S proteasome assembly in Drosophila melanogaster . FASEB J. 21, 2672–2682. (doi:10.1096/fj.06- 6751com) 16. Nonaka M, Kimura A. 2006 Genomic view of the evolution of the complement system. Immunogenetics 58, 701– 713. (doi:10.1007/ s00251-006-0142-1) 17. Celniker SE, Rubin GM. 2003 The Drosophila melanogaster genome. Annu. Rev. Genomics Hum. Genet. 4, 89–117. (doi:10.1146/annurev.genom.4. 070802.110323) 18. Harman D. 1981 The ageing process. Proc. Natl Acad. Sci. USA 78, 7124 –7128. (doi:10.1073/pnas. 78.11.7124) 19. Edgar D et al. 2009 Random point mutations with major effects on protein coding genes are the driving force behind premature aging in mtDNA mutator mice. Cell Metab. 10, 131–138. (doi:10. 1016/j.cmet.2009.06.010) 20. Hiona A et al. 2010 Mitcohondrial DNA mutations induce mitochondrial dysfunction, apoptosis and sarcopenia in skeletal muscle of mitochondrial mutator mice. PLoS ONE 5, e11468. (doi:10.1371/ journal.pone.0011468) 21. Doonan R, McElwee JJ, Matthijssens F, Walker GA, Houthoofd K, Back P, Matscheski A, Vanfleteren JR, Gems D. 2008 Against the oxidative damage theory of aging: superoxide disumatases protect against oxidative stress but have little or no effect on life span in Caenorhabditis elegans. Genes Dev. 22, 3236–3241. (doi:10.1101/gad. 504808) 22. Mesquita A et al. 2010 Caloric restriction or catalase inactivation extends yeast chronological lifespan by inducing H 2 O 2 and superoxide dismutase activity. Proc. Natl Acad. Sci. USA 107, 15 123–15 128. (doi:10.1073/pnas.1004432107) 23. Zhang Y et al. 2009 Mice deficient in both Mn superoxide dismutase and glutathione peroxidase-1 have increased oxidative damage and a greater incidence of pathology but no reduction in longevity. J. Gerontol. A Biol. Sci. Med. Sci. 64, 1212– 1220. (doi:10.1093/gerona/glp132) rsbl.royalsocietypublishing.org Biol. Lett. 11: 20150073 4 on March 18, 2015http://rsbl.royalsocietypublishing.org/Downloaded from
Original Source: https://www.researchgate.net/publication/273781783_Near-infrared_light_increases_ATP_extends_lifespan_and_improves_mobility_in_aged_Drosophila_melanogaster
TheraLazr Cold Laser Treatment of Parkinson Tremor
Dr. Stephen Riner D.C. - YouTube 2012 (Video) 4321
Dr. Riner uses LLLT to treat a patient with Parkinsons, the video shows the progression of the treatment
View Resource
This video shows before and after treatment footage of a patients with advanced Parkinsons. Treatment lasts about 2 weeks. Dr Riner is using the brain and neurostim setting on the brain, C5 Nerve Root and the Ulnar nerve in the elbow.
The TheraLazr is the prototype for the Avant LZ30 series of lasers.
video length: (2:03)
Original Source: https://www.youtube.com/watch?v=yOoV1AJ83-M
Epic 10 TMJ LLLT
- 2014 (Video) 4352
A woman receives LLLT for her TMJ, and experiences no pain afterward, but the title promotes the Epic 10 laser, possible bias.
View Resource
LLLT being used to treat a patient with TMJ. She experiences pain in her cheeks and neck particularly, and afterward claims to have no pain or discomfort. The doctor states that the LLLT has reduced inflammation, and relaxed the muscles that were causing the spasms.
video length: (2:43)
Original Source: https://www.youtube.com/watch?v=u28fAHZNRoQ
Oral Mucositis Academy of Laser Dentistry 2016
Annette Quinn - 2016 (Video) 4408
After reviewing other treatment options like radiation, Annette talks about how extremely effective laser can be on oral mucositis
View Resource
The laser info starts around 30 minutes into the presentation.
Original Source: https://www.youtube.com/watch?v=xU5_9169dbw
LLLT for spinal cord injuries presented by Prof Juanita Anders
Prof Juanita Anders - YouTube 2011 (Video) 4324
This is a 17 minute long presentation of LLLT research done on rats, the video is however associated with Thor
View Resource
The presentation includes research done on rats for the following conditions:
- Traumatic Brain Injury (TBI)
- Spinal Cord Injury
- Nerve regeneration
The research was supported by Thor so it could be biased but their research indicates that 810nm provides better stimulation of the cells.
video length: (17:09)
Original Source: https://www.youtube.com/watch?v=XxRIds1EKqk
Dr Burke, LLLT Patient Results
- 2014 (Video) 4354
(GRAPHIC CONTENT) This relatively unbiased 14 minute long presentation focuses on the results of LLLT on multiple patients by Dr. Burke.
View Resource
Dr. Burke shares some of his quite impressive results in patients who recieved LLLT, incuding:
- a woman with severe ulcers on her hand
- a horse with a leg wound
- an 88 year old woman with diabetes and an infected ulcer on her leg, soon to be amputated
- a 68 year old woman with a non-healing knee surgury wound
- a man with a 40 year old venous ulcer
- a woman with blood clots in her feet that led to gangreen, soon to be amputated
- a 12 year old girl with post herpetic Bell's Palsy
- a man with very bad leg fracture
- a woman with a jones fracture
video length: (13:46)
Original Source: https://www.youtube.com/watch?v=iJunHg5VFUM
THOR Low Level Laser Therapy LLLT Wound healing
- 2008 (Video) 4341
This video is a news report on LLLT, and it shows some promising results on a year old non-healing hernia, the video was posted to youtube by thor, possible bias.
View Resource
News report about the use of low level light therapy (LLLT) on a surgical wound that wouldn't heal after nearly a year in a patient with diabetes.
video length: (2:17)
Original Source: https://www.youtube.com/watch?v=faYpG_IOi08
LLLT treatment of Oral Mucositis
- 2008 (Video) 4348
This is a news report that explains the basics of LLLT and we hear from a patient that it was used to treat Oral Mucositis, the video was posted by thor, could be biased
View Resource
Young man with mucositis recieved a bone marrow transplant and was given LLLT both pre-, and post-op. He was expected to have serious mouth sores, but thanks to the LLLT he had minimal sores that quickly went away.
video length: (1:35)
Original Source: https://www.youtube.com/watch?v=9Mfrrga40yw
Pain Relief, Accelerated Healing with Laser Therapy, Chad Davis, DVM
- 2011 (Video) 4366
This is a video of Chad Davis, DMV, demonstrating the use of LLLT on A horse, it was made using a multi radiance laser so it may be biased
View Resource
Chad Davis, DVM, gives a demonstration of the effecacy of LLLT on a horse.
video length: (4:39)
Original Source: https://www.youtube.com/watch?v=nIwFJ2OHKms
RJ-LLLT in paralyzed dogs prevents surgery...
- 2014 (Video) 4344
In this video you will see before and after LLLT on 3 different paralyzed dogs, made by RJ Lasers could be biased
View Resource
This short video shows 3 before and after videos of paralized dogs who recieved LLLT and were able to walk again.
video length: (1:25)
Original Source: https://www.youtube.com/watch?v=McfHhMNo13I
Low Level Laser Therapy (LLLT): An Introduction
QB Medical - 2014 (Video) 4334
This is a 12 minute introductory video to LLLT
View Resource
This video discusses the basics of Low Level Laser Therapy. You will learn a little bit about lasers and laser history, and what makes a cold laser a cold laser. It also talks about the difference between lasers and LED's and why the latter may be less effective for medical therapy.
You'll find information on the treatment parameters of LLLT which are:
- wavelength
- power
- duty cycle (continueous or pulsed)
- energy density (dosage)
- treatment duration
It also goes over what indications the FDA has approved LLLT and infrared light for.
video length (12:13)
Original Source: https://www.youtube.com/watch?v=vnvOKXSLK8E
Introduction to LLLT
Dr. Michael Hamblin - 2009 (Video) 4340
Dr. Hamblin is a Harvard professor and has been studying the effects of LLLT for many years, but he is also associated with Thor.
View Resource
Dr. Michael Hamblin Talks about the differences between photodynamic therapy (PDT) and low level laser therapy (LLLT), and explains the basics of LLLT.
video length: (4:35)
Original Source: https://www.youtube.com/watch?v=7DdxPWmQPHk
Deep Tissue Laser Therapy Medical Animation
- (Video) 4320
This video was produced by LightCure so it is biased but it has one of the coolest graphic representation of the photobiomodulation using a therapy laser.
View Resource
In this video, you will see one of the better graphic representations of the photobiomodulation process including the release of ATP, NO, ROS.
This video was created by LightCure so at the end of the video, they try to make the point that class 4 laser are better than class 3 system. With the release of high-power class 3b (with power levels over 15 watts) system, this part of the video out of date.
video length: (3:08)
Original Source: https://www.youtube.com/watch?v=dB9MIW9fduk
Cold Laser Therapy of Knee Pain, Knee Sprains, Knee Tendinitis, and Chondromalacia Patella.
- 2013 (Video) 4382
This video talks about what LLLT is and touches on the differences between class III and IV lasers for LLLT
View Resource
Class IV K Laser is an excellent new treatment for helping muscle pulls, sprains, strains, and joint injuries. Cold Laser is a great treatment for speeding the recovery of knee pain, chondromalacia patella, patella tendonitis, and knee sprains. Lasers help increase cellular ATP, which is the cells energy source. Cells use the increased energy for healing and repair. Lasers are also excellent at increasing metabolic and repair process within the tissue. They decrease inflammation and pain around muscles, tendons, and joints. In addition, the speed recovery and healing of nerves, especially pain nerves.
video length: (1:51)
Original Source: https://www.youtube.com/watch?v=joh2jlWErsY&nohtml5=False
Cold Laser Therapy Treatment for Neuropathy caused by Diabetes
- 2013 (Video) 4387
Dr. Adam Zuckerman talks about his use of LLLT in patients with diabetes.
View Resource
Dr. Adam Zuckerman talks about his use of LLLT in patients with diabetes.
video length: (1:46)
Original Source: https://www.youtube.com/watch?v=pmDVhtNqJXA&nohtml5=False
Ron Hirschberg DVM veterinarian, interview about LLLT low level laser therapy
Ron Hirschberg - 2013 (Video) 4347
In this 13 minute video Ron Hirschberg, DMV, tells of his personal experience with LLLT, and on to his use of LLLT in his veterinary practice, the video is made by thor, so it could be biased
View Resource
Veterinarian Ron Hirschberg tells of how he first experienced laser therapy on his own arthritis, and decided to invest in lasers for his practice. Since he started using laser therapy on the pets he works with he has seen many positive results, he explains that gross profits from NSAIDs decreased from 0.71% to 0.3%, and laser profit now makes up 4% of the practice's income. He will treat between 3 and as many as 13 patients with LLLT, 95% of which he says improve noticably faster than those without LLLT.
viedo length: (13:37)
Original Source: https://www.youtube.com/watch?v=MLmE8QE27Ew
Recovery, Training and the Olympic Trials with NovoTHOR
Thor Lasers - Youtube (Video) 4472
This is a marketing video for the NovoThor staring several several Olympic athletes.
View Resource
Original Source: https://www.youtube.com/watch?v=pIyjKwi1aVg
Lyme Laser Centers of New England - Hanna
Lyme Laser Centers of New England - Youtube (Video) 4473
Here is a testmonial for using laser therapy to treat lyme disease.
View Resource
Original Source: https://www.youtube.com/watch?time_continue=1&v=vudIKG7Bf7E
Lyme Laser Centers of New England - Lauren
Lyme Laser Centers of New England - Youtube (Video) 4474
Here is a testmonial for using laser therapy to treat lyme disease.
View Resource
Original Source: https://www.youtube.com/watch?time_continue=1&v=vudIKG7Bf7E
Lyme Laser Centers of New England - Sarah
Lyme Laser Centers of New England - Youtube (Video) 4475
Here is a testmonial for using laser therapy to treat lyme disease.
View Resource
Original Source: https://www.youtube.com/watch?v=Sf8kL-AoSBY
Lyme Laser Centers of New England - Meghan
Lyme Laser Centers of New England - Youtube (Video) 4476
Here is a testmonial for using laser therapy to treat lyme disease.
View Resource
Original Source: https://www.youtube.com/watch?v=6UiPCdKpSoU
ATP: Adenosine Triphosphate
Bozeman Science - Youtube Educational Video (Video) 4507
This is a great introductory video about why ATP is the currency of life.
Spokane Chiropractor, Chiropractic Lifecenter, Cold Laser Therapy
- 2010 (Video) 4374
This is a short video demonstration of LLLT on a woman with restricted motion in her shoulders
View Resource
In this video Spokane Chiropractor Dr. Patrick Dougherty gives a quick demonstration of how cold laser therapy is used as a chiropractic treatment to help with range of motion by affecting the nervous system. This can be used as an effective adjunct to chiropractic adjustments when the brain is having a difficult time holding on to the input that the adjustments provides to the brain.
video length: (4:34)
Original Source: https://www.youtube.com/watch?v=vzGqgzKC76I&nohtml5=False
How LLLT Works
- (Video) 4337
This is an animation that helps to explain the processes behind LLLT, it is made by Thor so it may be biased
View Resource
This short animation from gives a simple description of how LLLT effects individual cells and things like:
- cytochrome c oxidase
- oxygen
- NADH
- Nitric oxide
- ATP
video length: (1:21)
Original Source: https://www.youtube.com/watch?v=VzMJUxalkFo
Cold Laser Therapy for Pain, Arthritis, Neck Pain
- 2011 (Video) 4373
Dr. Larry Lytle discusses LLLT, particularly for pain in an interview.
View Resource
Dr. Larry Lytle discusses LLLT, particularly for pain in an interview.
video length: (27:37)
Original Source: https://www.youtube.com/watch?v=VocXsehAb2c&nohtml5=False
Dr. Victor Dolan Demonstrates Cold Laser Therapy
- 2011 (Video) 4383
Dr. Dolan demonstrates LLLT on a sore back, while describing how LLLT works.
View Resource
Cold Laser Therapy can be very effective for those suffering from pain caused by auto accidents. Cold Laser Therapy is equally effective for those suffering from pain caused by work-related accidents. Athletes get great relief from sports-related injuries using Cold Laser Therapy. Cold Laser Therapy is a powerful therapy in the battle to relieve back pain, neck pain and joint pain.
Importantly, studies to date indicate that Cold Laser Therapy has no serious side effects when used by a trained healthcare professional. It is a non-invasive procedure requiring no surgical incision. There is no recovery time after a treatment. You do not have to take any medications relating to Cold Laser Therapy.
video length: (5:49)
Original Source: https://www.youtube.com/watch?v=paixoR44Bv0&nohtml5=False
LLLT Neck Pain Treatment
- 2008 (Video) 4342
A video of an LLLT procedure for neck pain
View Resource
Using LLLT to treat neck pain, procedure without wavelength or power, or any other laser parameters given.
video length: (1:14)
Original Source: https://www.youtube.com/watch?v=0gb0m1uFbhU
Cold Laser Therapy Demonstration? Austin Natural Family Medicine
- 2010 (Video) 4372
Dr. Fritz describes what LLLT is while giving a basic demonstration of the process
View Resource
Dr. Fritz teaches Obstetrics & Gynecology at the Academy for Oriental Medicine in Austin.
After getting undergraduate and graduate degrees in Biology from the University of Virginia, Dr. Vanessa Fritz graduated from the National College of Natural Medicine in Portland, Oregon, with a doctorate in Naturopathic Medicine (ND) as well as a Master of Science in Oriental Medicine (MSOM).
video length: (9:32)
Original Source: https://www.youtube.com/watch?v=mS6-o_iBDGE&nohtml5=False
Introduction to Cold Laser Therapy
- 2016 (Video) 4393
Dr. Christensen shares an introduction to cold lasers, their benefits and many uses
LLLT presentation HD
- 2015 (Video) 4359
This 20 minute long video presentation gives a basic description of LLLT and a list of dental issues LLLT has been used to treat, the video is specific to zolar laser, so it may be biased
View Resource
This video gives a somewhat in-depth list of dental issues that LLLT can be used to treat and how to treat them, along with a simple explaination of what LLLT is. At (16:48) there is a demonstration on how to use a Zolar laser for LLLT.
video length: (19:49)
Original Source: https://www.youtube.com/watch?v=ZJIEx9qemhk
K-Laser Mechanism of Action, Animal
- 2012 (Publication) 4399
This is a great K-laser graphic review of the mechanism for 970nm increasing circulation and 905nm for boosting oxygen and 800nm for boosting cytrochrome oxydase to produce more ATP.
View Resource
This video shows how red laser light interacts with blood and it talks in detail about the chemical process.
K-Laser Mechanism of Action, Animal from K-LaserUSA on Vimeo
Original Source: https://vimeo.com/49623761
Plantar Fasciitis, Achilles Tendonitis, Morton’s Neuroma - LLLT treatment using the FOX Laser
- 2015 (Video) 4358
This is a video demonstration of how to use a fox laser for LLLT for foot problems
View Resource
LLLT is known to dramatically improve conditions associated with soft tissue inflammations, not only by reducing pain, but also by providing a significant therapeutic advantage resulting in inflammation reduction, as well as expediting the healing process.
- Plantar fasciitis is an inflammation of the band of tissue (the plantar fascia) that extends from the heel to the toes. In this condition, the fascia first becomes irritated and then inflamed, resulting in heel pain. The most common cause of plantar fasciitis relates to faulty structure of the foot. Wearing non-supportive footwear on hard, flat surfaces puts abnormal strain on the plantar fascia and can also lead to plantar fasciitis.
- Achilles tendinitis is an overuse injury of the Achilles tendon, the band of tissue that connects calf muscles at the back of the lower leg to your heel bone. The structure of the Achilles tendon also weakens with age, which can make it more susceptible to injury — particularly in people who may participate in sports only on the weekends or who have suddenly increased the intensity of their running programs
- A neuroma is a thickening of nerve tissue that may develop in various parts of the body. The most common neuroma in the foot is a Morton’s neuroma, which occurs between the third and fourth toes. It is sometimes referred to as an intermetatarsal neuroma. Morton's neuroma seems to occur in response to irritation, pressure or injury to one of the nerves that lead to the toes.
video length: (3:25)
Original Source: https://www.youtube.com/watch?v=q4ASHpHcn8w
A guy with dentine hypersensitivity treated with LLLT
- 2015 (Video) 4362
A man who has just been treated with LLLT for his dentine hypersensitivity, video posted by Thor so it could be biased
View Resource
A man experiencing tooth sensitivity atests to pain reilief from LLLT.
video length: (0:54)
Laser Therapy Review Pain Management - Dr. Bernard Filner MD - Microlight ML830® Laser
- 2011 (Video) 4370
Dr. Bernard Filner MD Discusses his use of LLLT in pain management, but the video is made by microlight so it may be biased
View Resource
Dr. Bernard Filner MD Discusses his use of LLLT in pain management.
video length: (2:48)
Original Source: https://www.youtube.com/watch?v=fIlU4QDAuW0&nohtml5=False
How Theralase Laser Technology Works
Theralase - 2016 (Video) 4405
This is a biased promotional video but the graphic are a good intro to the chemical process.
View Resource
Original Source: https://www.youtube.com/watch?v=WeVBt5Ud_DM
Quantitative In Vivo Imaging of Tissue Absorption, Scattering, and Hemoglobin Concentration in Rat Cortex Using Spatially Modulated Structured Light
David J. Cuccia, David Abookasis, Ron D. Frostig, and Bruce J. Tromberg. - 2009 (Book) 4502
View Resource
12.1. INTRODUCTION
Significant changes in blood flow or in the integrity of cerebral vessels are believed to cause cerebrovascular disease (CVD) and to contribute to dementias including Alzheimer’s disease [1]. Stroke, the most serious form of CVD, is one of the leading causes of death and adult disability worldwide. Acute treatments for stroke, however, are severely limited. Neuroprotective drugs under development show promise at halting the ischemic cascade, but as yet, no such compound has received federal approval in the United States. One of the biggest limitations to this development is the lack of understanding of the mechanisms by which cerebral vessels react to factors such as ischemia, inflammation, blood pressure changes, metabolic demands, and trauma [2]. In order to address these fundamental questions, functional brain imaging techniques such as fMRI and intrinsic signal optical imaging (ISOI) have emerged as tools to visualize and quantify cerebral hemodynamics.
In the neuroscience community, ISOI has long been used to study the organization and functional architecture of different cortical regions in animals and humans [3–5] (see other chapters in this book). Three sources of ISOI signals that affect the intensity of diffusely reflected light derive from characteristic physiologic changes in the cortex. For functional neuronal activation, these have been observed to occur over a range of timescales, including (1) light scattering changes, both fast (over 10 s of milliseconds) and slow (i.e., > ~0.5 s) (2) early (~0.5–2.5 s) absorption changes from alterations in chromophore redox status, i.e., the oxy/deoxy-hemoglobin ratio (known as the “initial dip” period), and (3), slower (~2–10 s) absorption changes due to blood volume increase (correlated with the fMRI BOLD signal). Light scattering changes have been attributed to interstitial volume changes resulting from cellular swelling, organelle swelling due to ion and water movement, capillary expansion, and neurotransmitter release [6,7]. The slower absorption factors have been demonstrated to correlate with the changes in metabolic demand and subsequent hemodynamic cascades following neuronal activation [4,8,9].
Using animal models of acute and chronic brain injury, ISOI has been used to quantify the acute hemodynamic events in response to stroke, including focal ischemia and cortical spreading depression (CSD) [10–21]. Researchers have also used ISOI to locate and quantify the spatial extent of the stroke injury, including ischemic core, penumbra, and healthy tissue zones [18,22]. CSD also plays a key role in migraine headache, and recent laser speckle imaging studies have revealed the neurovascular coupling mechanism to the transmission of headache pain [23,24].
To fully understand the underlying mechanisms in vascular changes associated with cerebrovascular diseases such as stroke, an optical imaging technique that has the capability to rapidly separate absorption from scattering effects can enhance the information content of traditional ISOI, enabling (1) more accurate quantitation of hemodynamic function, (2) isolation of the electro-chemical changes characterized by light scattering, and (3) longitudinal chronic injury studies of function where structural reorganization due to neovascularization can cause significant alterations in scattering [25,26].
Quantitative diffuse optical methods [27] such as spatially-resolved reflectance, diffuse optical spectroscopy (DOS), and tomography (DOT), and diffuse correlation spectroscopy (DCS) possess exquisite sensitivity to these functional and structural alterations associated with brain injury, and have been applied to the study of CSD [11,15,28]. DOS and DOT utilize the near-infrared spectral region (600–1000 nm) to separate and quantify the multispectral absorption (μa) and reduced scattering coefficients (μs′), providing quantitative determination of several important biological chromophores such as deoxy-hemoglobin (HbR), oxy-hemoglobin (HbO2), water (H2O), and lipids. Concentrations of these chromophores represent the direct metrics of tissue function such as blood volume fraction, tissue oxygenation, and edema. Additionally, the scattering coefficient contains important structural information about the size and density of scatterers and can be used to assess tissue composition (exctracellular matrix proteins, cell nuclei, mitochondria) as well as follow the process of tissue remodeling (wound healing, cancer progression). DOS utilizes a limited number of source-detector positions, e.g., 1–2, but often employs broadband content in temporal and spectral domains [29]. In contrast, DOT typically utilizes a limited number of optical wavelengths (e.g., 2–6) and a narrow temporal bandwidth, but forms higher resolution images of subsurface structures by sampling a large number of source-detector “views.” To achieve maximal spatial resolution, the ideal DOT design would employ thousands of source-detector pairs and wavelengths. However, several engineering considerations including measurement time and instrument complexity currently limit the practicality of this approach.
In this chapter we present the basic principles of a new, noncontact quantitative optical imaging technology, modulated imaging (MI) [30–32], and provide examples of MI performance in 2 rat models of brain injury, cortical spreading depression (CSD) and stroke. MI enables both DOS and DOT concepts with high spatial (<1 mm) and temporal resolution (<1 s) in a simple, scan-free platform. MI is capable of both separating and spatially-resolving optical absorption and scattering parameters, allowing wide-field quantitative mapping of tissue optical properties. While compatible with time-modulation methods, MI alternatively uses spatially modulated illumination for imaging of tissue constituents. Periodic illumination patterns of various spatial frequencies are projected over a large area of a sample. The diffusely reflected image is modified from the illumination pattern due to the turbidity of the sample. Typically, sine-wave illumination patterns are used. The demodulation of these spatially modulated waves characterizes the modulation transfer function (MTF) of the material, and embodies the sample optical property information.
12.2. METHODS AND INSTRUMENTATION
12.2.1. Modulated Imaging Spectroscopy
The MI instrument platform was introduced originally by Cuccia et al. [30] Based on this design, we have developed a custom multispectral near-infrared (NIR) MI spectroscopy system capable of imaging between 650 and 1000 nm. A diagram of this system is shown in Figure 12.1.
FIGURE 12.1
Modulated imaging platform. QTH—quartz tungsten halogen; L1—aspheric condenser; H—hybrid hot mirror; DMD—digital micromirror device; L2—projection lens; L3—camera lens; LCTF—liquid crystal tunable (more...)
Broadband NIR illumination is provided by an intensity-stabilized 250 W quartz-tungsten-halogen (QTH) lamp (Oriel QTH Source with Light Intensity Controller, Newport Corporation-Oriel Instruments, Stratford, Connecticut). Light is collimated and refocused with a pair of aspheric F/#0.7 optical lens systems (Oriel Aspherab). A custom-sized 3.5 in square hybrid hot mirror (Reynard Corporation, i.e., R00670-00) was placed between the lenses to limit the illumination to wavelengths below 1000 nm. Light engine optics taken from a digital projector (NEC HT1000) serve to homogenize and direct the light onto a 0.7 in digital micromirror device (DMD Discovery™ 1100 with ALP Accessory Package, ViALUX, Germany). Grayscale spatial sinusoid patterns are projected at 400 Hz using the ViALUX software development toolkit, which generates the necessary pulse-width modulation of binary sub-frames to produce a specified grayscale bit-depth (1–8 bits). Finally, a fixed focal length (f = 100 mm) projection lens illuminates the tissue at a slight angle from normal with a 15 × 25 mm illumination field. Detection was performed at normal incidence using a CRI Nuance™ camera system, which combines a 12-bit CCD camera and a liquid crystal tunable filter (LCTF; λ = 650–1100 nm, Δλ = 10 nm). To avoid specular reflection, crossed linear polarizers are used in the illumination and detection arms. For this system, the former is a 1.5 in diameter NIR linear polarizer (Meadowlark Optics, VLM-200-IR-R) placed immediately after the projection lens, and the first stage of the Nuance LCTF serves as the latter. The DMD, CCD, and LCTF are controlled via USB by a laptop computer, and synchronized using LabVIEW software (LabVIEW 8, National Instruments), enabling fast acquisition of a series of patterns with various spatial frequencies.
12.2.2. SFD Measurement, Calibration, and Modeling
A detailed description of SFD measurement, calibration, and diffusion modeling is provided by Cuccia [32]. In this work, we modeled diffuse reflectance using a transport-based White Monte Carlo (WMC) method [33,34]. Previously, we have found that compared with Monte Carlo, (1) diffusion predictions over- and underestimate low- and high-frequency diffuse reflectance, respectively, and (2) the quantitative accuracy of diffusion degrades with decreasing albedo [32]. Due to the moderate albedo of brain tissue (μs′/μa ~ 10–20), we chose to analyze all brain data with the WMC approach. This homogeneous tissue model is a significant simplification of the multilayered rat brain, and more work is necessary to accurately model this complex system. We discuss further the consequences of our simple model in Section 12.2.5.
12.2.3. Optical Property Inversion Methods
In this chapter, we use two inversion methods to calculate the absorption and reduced scattering from measurements of diffuse reflectance. When high measurement precision is desired, we use a “sweep” in spatial frequency space, producing an overdetermined set of diffuse reflectance measurements, which can be fitted to our WMC forward model predictions using least-squares minimization. This method is performed for all spatially averaged region analysis of optical properties and chromophores. When increased acquisition and/or processing speed is desired, we alternatively use a rapid two-frequency lookup table method based on cubic spline interpolation [32]. This data can be achieved with a minimal 3-phase, single frequency image set (by demodulating and averaging the images to obtain AC and DC amplitude maps, respectively). On typical personal computers this approach is capable of millions of inverse lookup calculations per second, and is therefore used to calculate all high-resolution images including time sequences. The signal-to-noise ratio (and thus the measurement precision) of either approach is limited by the data sampling, with the two-frequency method having a lower precision with the tradeoff of higher acquisition and processing speed.
12.2.4. Spectral Analysis-Chromophore Calculation
The quantitative absorption coefficient is assumed to be a linear (Beer’s law) summation of individual chromophore absorption contributions:
μa(λ)=2.303∑i=13ci?i(λ),
12.1
where ci and ?i(λ) represent chromophore concentrations and molar extinction coefficients, respectively. Using reported extinction coefficients of HbO2/HbR35 and H2O,36 we can invert Equation 12.1 and calculate tissue chromophore concentration separately at each pixel by linear least-squares fitting to the multispectral absorption images. Total hemoglobin (HbT) and oxygen saturation (StO2) can then be calculated as HbT = HbR + HbO2 and StO2= HbO 2/(HbR + HbO2) * 100, respectively.
12.2.5. Optical Property Mapping: Resolution Versus Quantitation
On a pixel-by-pixel basis, diffuse reflectance versus spatial frequency is fitted to the WMC forward model to extract the local absorption and reduced scattering optical property contrast. This process is repeated for each wavelength, resulting in multi-spectral absorption and scattering spectra at each pixel. The measured contrast from discrete absorbers and scatterers on millimeter and submillimeter spatial scales, however, will possess partial volume effects in all three spatial dimensions. This is due to the physical light transport length scales in tissue, limiting the true x-y resolution of optical property contrast to many detector pixels [32]. This phenomenon is not unique to MI, but present in all planar reflectance imaging measurements of turbid media. Absorption and scattering are calculated using a homogeneous reflectance model, extracting a locally averaged sampling of optical property contrast. Based on simulations of the tissue MTF for varying optical properties [32], we expect the resulting image resolution to scale directly with the transport length, l* = (μa + μs′)− 1, and the spatial frequency of illumination. In this chapter, we place quantitative emphasis on average optical properties and chromophores measured over a field of view that is greater than l*. Spatial maps and videos of these parameters are displayed and referred to as “contrast maps,” with the caveat that high resolution features will exhibit degraded quantitative accuracy.
12.2.6. In Vivo Rat CSD Experiments
12.2.6.1. Animal Preparation
MI spectroscopy measurements were performed on an in vivo Wistar rat model with a thinned-skull preparation. All procedures were performed in accordance with approved IACUC protocol guidelines. The animals were anesthetized, placed in a stereotaxic frame, their skulls thinned and glass coverslip applied. This preparation is described in detail by Masino et al. [37] The resulting thinned skulls allowed direct imaging of the cortex over a 5 × 7 mm field-of-view (whisker barrel cortex, centered at the C2 location). In order to investigate the sensitivity of MI toward studying acute cortical injury, we induced cortical spreading depression (CSD) by applying 1 M KCl solution to the surface of the cortex through a perforated section of skull and dura, located approximately 3 mm above the camera’s imaging field.
12.2.6.2. MI Measurement Protocol
For each of three animals, our MI measurement protocol was twofold. Prior to CSD induction, baseline spatial modulation data were acquired at 6 spatial frequencies (3-phase projections each) from 0 to 0.26 mm−1, at 10 nm intervals over the entire range between 650 and 980 nm. Depending on the wavelength, image acquisition times ranged from 200 ms to 4 s, with total spectral imaging time of approximately 30 s per spatial pattern. The entire measurement (34 wavelengths, 3 phases, 6 frequencies) was repeated three times for statistical averaging yielding an entire measurement time of approximately 30 min.
Next, rapid dynamic measurements were performed, beginning 1 min prior to K+Cl− administration. Here, a significantly reduced data set was chosen in order to achieve high temporal resolution. Two spatial frequencies (0 and 0.26 mm−1) were acquired with three phase projection images, as described in Section 12.2.2, at each of four wavelengths (680, 730, 780, and 830 nm). The resulting 12 images took in total 6 s, permitting a repetition rate of 10 measurements per minute. The animals were followed for a period of 10 min for rats 1 and 2, and a period of 30 min for rat 3.
All images in this study were smoothed by 2D convolution with a Gaussian filter function (FWHM = 3 pixels), and baseline repetitions were averaged prior to data processing. Additionally, time-series data were post-processed by smoothing slightly in time (Gaussian FWHM of 2 timepoints = 12 s).
12.2.6.3. Spatial Frequency Sensitivity Analysis
Because of the differential absorption sensitivity at low and high frequencies, optimal optical property separation is achieved when a large range of frequencies is used [31]. In Figure 12.2a, we depict this differential sensitivity using diffuse reflectance (MTF) predictions versus frequency, increasing μa by 100% from 0.02 (black line) to 0.04mm−1 (gray line). This is done for two values of μs′, 0.6 (solid lines) to 1.2mm−1 (dashed lines), simulating a 100% change in scattering. Notice that the low frequencies have a significant reflectance change due to absorption, while high frequency reflectance remains nearly unchanged. Conversely, reflectance changes due to scattering are observed at all spatial frequencies. In Figure 12.2b, we further visualize this by plotting the reflectance sensitivity to 1% changes in absorption and scattering. Whereas DC reflectance is equivalently sensitive to a fractional change in either absorption or scattering, at high spatial frequencies absorption contrast is lost while scattering contrast is retained. For instance, notice that at our maximum measurement frequency of 0.26 mm−1 the reflectance is roughly 24 times more sensitive to scattering compared to absorption (ΔRd = 0.56 μs′ versus 0.024 * 10−3 for μa). This plays an important role in Section 12.3.2 during our discussion of dynamic scattering measurement.
FIGURE 12.2
(a) Reflectance contrast in absorption and scattering covering a typical range of brain optical properties. (b) The frequency-dependent sensitivity to absorption (black line) and scattering (gray line), respectively. Reflectance at fx = 0.26 mm−1 (more...)
In realistic heterogeneous tissues, a tradeoff exists between maximizing the frequency range for optical property accuracy and obtaining similar sampling volumes. As tissue is a low-pass spatial filter, high frequencies are attenuated quickly with depth. Using diffusion-based forward modeling, we have estimated mean sampling depths at 650 nm using measured average background optical properties of brain tissue. This was done by predicting the depth sensitivity to contrast from a planar perturbation in absorption, given a background fluence profile from spatial frequencies 0 and 0.26 mm−1. Based on these results, we observe qualitatively similar depth sampling, with mean depth sampling ranging between 2.5 mm and 1.2 mm (for fx = 0 and 0.26 mm−1, respectively). In all cases maximal sensitivity was found in the first 1–2 mm, where cortical hemodynamic changes occur.
12.3. RESULTS AND DISCUSSION
12.3.1. Baseline MI Spectroscopy
In Figure 12.3a we show a grayscale planar reflectance image of the cortical region of rat 1 at 650 nm. A dotted-line box denotes the region-of-interest (ROI) used for analysis, selected for its uniform illumination and the absence of cerebral bruising. The Monte Carlo-model fitting of spatial frequency data allows calculation of the absorption and reduced scattering coefficients. In Figure 12.3b we show the spatially averaged diffuse reflectance at 650 nm and the corresponding multi-frequency fit. Excellent agreement is observed between measurement data and the model-based fit, with derived μa and μs′ coefficients of 0.033 and 0.70 mm−1, respectively.
FIGURE 12.3
(a) Reflectance map for rat 1, showing the 3.8 × 5.9 mm region chosen for quantitative analysis. (b) Sample MTF reflectance data (squares) and fit (solid line) at 650 nm. (c) Recovered optical property maps (above) and corresponding image histogram (more...)
Analysis of multifrequency reflectance data separately at each pixel results in spatial maps of absorption and reduced scattering contrast. In Figure 12.3c, we plot the μa and μs′ maps recovered at 650 nm for rat 1. Note the strong absorption in the vein region, due to a large absorption by HbR at this wavelength. Below the images, we show histogram distributions of the corresponding quantitative maps above, indicating the degree of spatial variation in recovered optical properties. The mean and standard deviation for the pixel-wise μa and μs ′ were 0.030 ± 0.007 mm−1 and 0.63 ± 0.13 mm−1, respectively. These statistical results are in good agreement with the spatially averaged reflectance fit from Figure 12.3b, suggesting that our simple pixel-wise fitting approach yields optical properties similar to that calculated using a global analysis.
By mapping the absorption coefficient at multiple wavelengths, we can perform quantitative spectral imaging of tissue. In Figure 12.4, we summarize the baseline spectroscopy results for all three animals. In Figure 12.4a we show the μa (left) and μs′ (right) coefficients versus wavelength (circles) recovered from spatially averaged fitting. Data for rat 1 is shown in black (rat 2 in dark gray; rat 3 in light gray). Note the distinct spectral features in absorption, resulting from oxy- and deoxy-hemoglobin (HbO2, HbR), and water (H2O) absorption. The calculated scattering coefficient generally decays with increasing wavelength, and the results from a power law (μs ′ = A·λ(nm) −b, solid lines) fit are shown. A small residual coupling is observed between measured scattering and absorption spectral features. In particular, the scattering at the shortest and longest wavelengths appears to be underestimated by 5–10%, occurring where the corresponding absorption is highest (due to HbR and H2O, absorption features, respectively). Based on our experiments in layered tissue phantoms [38], we believe this effect is primarily due to frequency-dependent probing volumes in the presence of depth-heterogeneous structures.
FIGURE 12.4
(a) Average μa (left) and μs′(right) spectra over entire ROI (circles). HbO 2, HbR, and H2O concentrations are determined by subsequent least-squares fitting (solid lines) of molar extinction coefficients to the absorption. Data (more...)
Simultaneous linear fitting of the absorption to known extinction coefficients yields measures of chromophore concentration. Shown in Figure 12.4a, multispectral fitting (solid line) for rat 1 yields HbO2, HbR, H2O, HbT and StO2 values of 56.3 μM, 33.2 μM, 63.9%, 89.6 μM, and 56.3%, respectively. Tabulated results of chromophore values for all three animals are shown in Figure 12.4b. Lipid absorption near 930 nm was not apparent in the μa spectrum, and when included in the spectral analysis was not found to significantly affect the results. The small absorption “bump” at 900–910 nm is an artifact of imperfect phantom calibration due to the presence of a sharp, strong silicone absorption peak that is present in the phantom.
We note that the solution for chromophore concentration is well-determined when the number of wavelengths is at least equal to the number of chromophores. Therefore, as few as two wavelengths can be used to separate HbO2 and HbR (if a constant value of H2O is assumed). Repeating the above analysis with 780 and 830 nm only (assuming H2O = 65%) yields results for HbO2 and HbR within 10% of those from full spectral fitting. Repeating the above analyses using a simple diffusion-based model provided qualitatively similar results for absorption and scattering spectra, but in general was found to overestimate the absorption coefficient by 10–25%.
Absorption spectra at each pixel can be separately analyzed to yield spatial maps of local HbO2, HbR, and H2O distribution, shown in Figure 12.5. Notice the high concentration of HbR over the large superficial draining vessel (venous) regions, also reflected in the StO2 image, highlighting the effect of tissue oxygen extraction. Conversely, notice that the high albedo regions with less structural detail are highly oxygenated, with StO2 levels between 60 and 70%. Lastly, the H2O map reveals a relatively homogeneous distribution of water.
FIGURE 12.5
Chromophore fits to absorption spectra at each pixel yield maps of local HbO2, HbR, and H2O concentration (left). Total hemoglobin (HbT) and oxygen saturation (StO2) maps can then be calculated from HbO2 and HbR.
12.3.2. Dynamic MI Spectroscopy of CSD
We performed measurements of CSD in each of the three rats, as described in Section 12.2.3. The results are presented as follows. We first present data for a single animal, choosing rat 3 for its long observation period of 30 minutes. Three ROIs are selected for analysis, and baseline MI spectroscopy results are reported for each of these regions. Next, the observed dynamic time courses of diffuse reflectance, optical properties, and chromophore concentrations are shown for each ROI. We then present the full spatio-temporal dynamic contrast data for rat 3 (2D + time) in the form of “snapshot” images.
Figure 12.6 summarizes the baseline spectroscopy measurements for rat 3. In Figure 12.6a, we show three regions of interest superimposed on the DC reflectance map, chosen to highlight three different characteristic temporal profiles observed within the field of view. In Figure 12.6b we show the baseline spectral fits for each of these regions, and in Figure 12.6c we tabulate the resulting calculated chromophore concentrations. In general, Region A (black) is a high albedo region lacking any large blood vessels, whereas Regions B (dark gray) and C (light gray) include high-absorption blood vessels and mild cerebral bruising from surgery. These differences are apparent in their recovered absorption spectra and fits, with on average 27% higher HbT, and 32% lower saturation in the vascular regions. Also, 7% higher H2O is found in Regions B and C, which may indicate increased edema due to bruising.
FIGURE 12.6
Regionwise spectral analysis of rat 1 baseline data including the respective (A) ROIs, (B) spectral absorption data (circles) and fit (lines), and (C) tabulated recovered chromophore data for each region
In Figures 12.7–12.9 (for regions A–C, respectively), we present the temporal dynamics of CSD in each ROI of rat 3 as measured by MI. In part (a) of each figure, we plot the multispectral diffuse reflectance changes at fx = 0 mm−1 (DC, top) and fx = 0.26 mm−1 (AC, bottom). In part (b), we plot the recovered Δμa (top) and Δμs′ (bottom) optical properties at each wavelength. While absolute values of diffuse reflectance and optical properties are measured separately at each time point, for visualization purposes all data are displayed as a change from that prior to KCl administration. Absolute optical property values at t = 0 (not shown) demonstrate excellent agreement (~5–10%) with full multifrequency baseline data.
FIGURE 12.7
(A) Multispectral diffuse reflectance at DC (fx = 0 mm−1, top) and DC (fx =.26 mm−1, bottom) for Region A of rat 3 over approximately 30 min. (B) Corresponding recovered multispectral absorption (top) and reduced scattering (bottom) coefficients. (more...)
FIGURE 12.8
(A) Multispectral diffuse reflectance at DC (fx = 0 mm−1, top) and DC (fx = 0.26 mm−1, bottom) for Region B of rat 3 over approximately 30 min. (B) Corresponding recovered multispectral absorption (top) and reduced scattering (bottom) (more...)
FIGURE 12.9
(A) Multispectral diffuse reflectance at DC (fx = 0 mm−1, top) and DC (fx = 0.26 mm−1, bottom) for Region C of rat 3 over approximately 30 min. (B) Corresponding recovered multispectral absorption (top) and reduced scattering (bottom) (more...)
Looking first at the reflectance time courses of Figure 12.7a (Region A), we see in general a series of three CSD events over the 30 minutes, with each transient event occurring for approximately 4.3 minutes. The first event occurs at minute 2.9 after KCl application, indicating an initial latency between the insult and the first resulting spreading depression wave. Reflectance contrast is present in both DC and AC frequency components, but with markedly different signatures. Generally, the DC time course shows a slow, gradual decay, punctuated by sharp, wavelength-dependent spikes/dips (for short/long wavelengths, respectively). Alternatively, the AC signature contains three sets of transient dips consistent across all wavelengths, with final values leveling off progressively lower than baseline. Discussed in detail in the following paragraph, we believe these AC changes are due primarily a result of optical scattering and may be related to neuronal depolarization. The corresponding derived optical properties in Figure 12.7b reflects this, with μs′ trends tracking directly with the measured AC reflectance. As expected, μa trends reveal similar wavelength-dependence of the DC reflectance (with opposite polarity), reflecting changes in HbO2 and HbR.
In Section 12.2.3.3 we noted that the diffuse reflectance at fx = 0.26 mm−1 is 23 times more sensitive to scattering changes compared to absorption. In this context, we propose that the observed magnitude of the CSD-induced AC reflectance changes can only be explained by changes in optical scattering. To concretely illustrate this point, we pick as an example the observed 780 nm AC diffuse reflectance dip in Figure 12.7a at t = 3.7 min of -0.003. Here, the corresponding change in reduced scattering in Figure 12.7b, Δμs′, is calculated to be −0.03 mm−1. In order for this change to instead be due to an absorption-only event, μa would need to increase by 121% from baseline (from 0.038 to 0.084 mm−1). This increase would also need to be accompanied by a drop in Rd (fx = 0 mm−1) of 0.12 (33%), whereas the actual observed DC reflectance only drops by 0.008 (<1%) and thus cannot explain the change. Secondly, we note that the three sets of AC reflectance dips occur consistently across all four wavelengths. While an approximate 120% increase in HbT could induce this decrease at high frequency, it would also require a large broad-wavelength decrease in the DC reflectance. We instead observe during these events that the DC increases at short wavelengths while the DC decreases at long wavelengths, suggesting primarily an exchange between HbO2 and HbR volume fractions, as opposed to a dramatic HbT change.
Regions A–C (Figures 12.7–12.9) were chosen to highlight three different time signatures observed in the field of view during the CSD dynamics. The most contrasting feature between all three regions is the measured AC reflectance and the derived scattering coefficient. In Region B (Figure 12.8), each CSD event appears to cause a biphasic scattering change, with a sharp increase and then decrease, whereas a monophasic dip was observed in Region A (Figure 12.7). Region C (Figure 12.9) appears even more complex with a triphasic rise-dip-rise temporal profile. We observe that Regions A to C are located with increasing proximity to the CSD induction point (3 mm above the imaging field).
Because fractional changes in scattering and absorption have an equal (and opposite) effect on DC reflectance (see Section 12.2.3.3), any scattering (i.e., pathlength) changes measured here could be misinterpreted as absorption events with traditional ISOI analyses (i.e., DC reflectance only). In our observations, the measured scattering change of up to −0.05 mm−1 would be interpreted as an increase in absorption of up to +0.005 mm−1, more than the maximum measured absorption change for wavelengths 730, 780, or 830 nm in any of the three regions. In order to account for differential pathlength changes, Kohl et al. proposed a multispectral model [39], which they used to differentiate dynamic scattering and absorption changes using ISOI. This approach improves ISOI accuracy, and has been generally adopted as the method of choice for quantitative functional imaging. For dynamic measurements, we see MI as an improvement over this approach as it alternatively uses frequency domain measurements at a single wavelength to derive absolute scattering and absorption coefficients. This potentially provides a simplified single-wavelength measurement apparatus for detection of scattering, and also avoids potential mis-estimation of background optical properties.
Light scattering changes induced by spreading depression have been reported previously, and a comprehensive review is provided by Somjen. With in vivo spatially resolved reflectance measurements, Kohl et al. [11] separated absorption from scattering and observed a biphasic scattering response similar to that of Region A. With simultaneous laser scattering and electrophysiological measurements, both Jarvis et al. and Tao et al. found a strong correlation between electrical and optical scattering changes [12,13,40]. Tao et al. noted spatial heterogeneity in the dynamic spreading depression (SD) waveform related to the proximity to the SD induction site, similar to our results.
Using linear spectral analysis of absorption at all four wavelengths, we calculated the time-dependent chromophore concentration for Regions A, B, and C, presented in Figure 12.10A,B,C, respectively. In each region, the calculated baseline concentrations of H2O were assumed to be constant. All three regions exhibit remarkably similar trends in HbR, HbO2, HbT, and StO2. This similarity is not clear in the DC traces of Figures 12.7–12.9, further highlighting the benefit of accurate separation of μa and μs′. Focusing on the first CSD event, there is a very consistent signature of: (1) a 2-minute latency post-KCl administration, (2) a 30-second period of decreasing StO2 (3) a dramatic spike in both StO2 (3–10%) and HbT (2–4 μM) with rise and decay times of approximately 1 minute each. For each region, the final StO2 is approximately 5–10% lower than baseline, while the HbT restores to baseline values. This process repeats again twice more, except that the phase (2) desaturation appears to be absent. Additionally, in the “vessel” Region 3, we observe a gradual increase in HbT over the 30 minutes, indicating chronic blood pooling.
FIGURE 12.10
Recovered HbR, HbO2, HbT, and STO2, for ROIs A, B, and C (top, middle, and bottom), recovered by analysis of the multispectral absorption coefficients from Figures 12.7–12.9b (top).
We show in Figure 12.11 the spatio-temporal evolution of both chromophore concentration and scattering changes from the first SD wave in rat 3. These are depicted in the form of a time derivative, i.e., (C(tn + 1) − C(tn))/(tn + 1 − tn), where C represents concentration/saturation/scattering values and tn represents time of acquisition for data point n. This visualization is appealing as it highlights the changes with high contrast [18]. From left to right, we show HbO2, HbR, HbT, StO2, and μs′. Notice the wave in scattering which propagates from top right to bottom left, at a rate of approximately 3 mm/min. An increase, or “spike” in scattering is observed initially in the top right hand corner, in close proximity to the location of KCl administration. Note the large spikes in HbT and StO2 due to vascular activity from depression wave propagation through the measurement field. We observe a transient increase in saturation and blood volume. Over the longer time periods, however, we observe a slow, sustained trend toward hypoxia in the vein regions.
FIGURE 12.11
Spatio-temporal evolution of the hemodynamic and neural scattering response during a single spontaneous CSD event in rat 3. For visualization, a time derivative of the image sequence is displayed to highlight changes.
The spatio-temporal evolution of the scattering coefficient in Figure 12.11 reveals a spatially defined scattering wave (reduction in μs′) that precedes hemodynamic changes. The scattering drop is presumed to be a consequence of neuronal depolarization accompanying CSD. This observed wave pattern has been shown previously with reflectance ISOI and attributed to blood volume changes [18]. Interestingly, the scattering depolarization wave is clearly followed in space and time by the increase in deoxyhemoglobin (HbR), decrease in saturation (StO2), and drop in oxyhemoglobin (HbO2); changes that are consistent with depolarization-induced neural tissue oxygen consumption.
12.3.3. Dynamic MI Spectroscopy of Stroke
In order to assess the sensitivity of MI to stroke, we conducted preliminary studies in a rat middle cerebral artery occlusion (MCAo) model, the most commonly involved artery in ischemic strokes. The left MCA was surgically cauterized using monopolar cautery or ligated to produce a permanent stroke. Figure 12.12 shows pre-versus post-MCAo results for a representative animal. Data were acquired at 5 wavelengt
Original Source: https://www.ncbi.nlm.nih.gov/books/NBK20233/
Laser Therapy Review - Sue Hale PT - ML830® Cold Laser
- 2012 (Video) 4381
A physical therapist describes her usage of LLLT both personally and professionally, video specific to a microlight laser so it could be biased
View Resource
Sue Hale, Physical Therapist. Hand therapist in Melbourne FL. Sue speaks of her experiences using the Microlight ML830® Cold Laser in her practice and personally. Sue uses the ML830® Laser daily for treating all types of injuries; from hand injuries, back pain and injuries, runner's injuries, knee injuries, and many other conditions.
video length: (1:17)
Original Source: https://www.youtube.com/watch?v=m2kYC8DGFJ8&nohtml5=False
Cold Laser Therapy for Dogs and Cats
- 2013 (Video) 4394
This video shows several pets with their owners after LLLT
Recovery of Django the Dog
- 2015 (Video) 4357
(3 short videos) Django the dog has a grade 2 medial patellar luxation, and receives LLLT before and after surgery to alleviate pain.
View Resource
Django's 1st Low Level Laser Therapy (LLLT)
Django is now 13 months old and has had clicking and obvious pain in his right knee for the last 6 months. After a negative valley fever test & 2 knee x-rays showing no fracture or tumors,and being told by 2 vets, it's possibly a soft tissue (CCL/ACL) injury and that he needed a CT, MRI or arthroscopy to get a more definitive diagnosis. Django's owner decided to try LLLT to alleviate some of his pain.
video length: (0:32)
Django Post MPL Surgery Days 1-2
Django had surgery (medial imbrication, with a lateral release & anti-rotational sutures) on his left knee to correct a grade 2 medial patellar luxation August 20, 2015-. Here he is the day of surgery from check in through 48 hours later getting cold laser therapy.
video length: (1:27)
Loving Life
Here's Django approximately 9 weeks post-op, fully enjoying the newfound use of his leg.
video length: (1:41)
More videos of Django's journey can be found on his owner's Youtube channel, link below.
Original Source: https://www.youtube.com/channel/UCVCp5py29hdRoosgAJ_qIbA
Using Cold Laser Therapy to Help Children with Learning Disabilities
- 2015 (Video) 4396
A video of a young man who received LLLT for learning disabilities, the video was made by the clinic that treated him, so keep that in mind
View Resource
The young man featured in this video had a history of cognitive issues, including difficulty with reading and comprehension.
video length: (1:54)
Original Source: https://www.youtube.com/watch?v=u5Zs3NSefa4
Avant LZ30 Instructional videos
- 2015 (Video) 4369
(3 5ish minute videos) These videos show you how to use and be safe with the Avant LZ30 family of lasers
View Resource
This video covers the operation of the LZ30 family of lasers in Basic Mode.
video length: (3:47)
This video covers the Advanced Features of the LZ30 family of lasers.
video length: (6:17)
This video covers Safety and Regulatory Considerations for the use of the LZ30 family of lasers.
video length: (3:49)
Original Source: https://www.youtube.com/watch?v=pkSYuEIxZc0&nohtml5=False
Class 3B vs Class 4 laser therapy penetration
- 2012 (Video) 4343
Penetration depth test between a high powered class 4 970nm laser and a low powered class 3b LLLT 810nm laser, by shining through hand, this is made by Thor, could be biased
View Resource
Penetration depth test between a high powered class 4 970nm laser and a low powered class 3b LLLT 810nm laser, by shining through hand.
- Class 4 Laser: 11-55mW went through hand
- Class 3b LLLT Laser: 55-90mW went through hand
Result: 810nm laser passes through tissue better than 970nm Laser
video length: (3:09)
Original Source: https://www.youtube.com/watch?v=UASgE-yO8Xk
Cold Laser Therapy speeds healing for Dogs and Cats
- 2013 (Video) 4376
This is a video demonstration of LLLT on a dog with inflammation and pain in his paw
View Resource
Demonstration of LLLT on a dog with inflammation, and pain in his paw.
video length: (3:36)
Original Source: https://www.youtube.com/watch?v=Hg4ruVCNp7o&nohtml5=False
The energy density of laser light differentially modulates the skin morphological reorganization in a murine model of healing by secondary intention.
Novaes RD1, Gonçalves RV, Cupertino MC, Araújo BM, Rezende RM, Santos EC, Leite JP, Matta SL. - Int J Exp Pathol. 2014 Apr;95(2):138-46. doi: 10.1111/iep.12063. Epub 2013 Dec 20. (Publication) 593
This study on scar tissue found that higher energy density investigated was more effective in modifying the morphology of the parenchyma and stroma of the scar tissue and led to a faster healing. The max tested and best dosage was found to be 30 J/cm(2).
View Resource
Abstract
This study investigates the influence of gallium–arsenide (GaAs) laser photobiostimulation applied with different energy densities on skin wound healing by secondary intention in rats. Three circular wounds, 10 mm in diameter, were made on the dorsolateral region of 21 Wistar rats weighting 282.12 ± 36.08 g. The animals were equally randomized into three groups: Group SAL, saline solution 0.9%; Group L3, laser GaAs 3 J/cm2; Group L30, laser GaAs 30 J/cm2. Analyses of cells, blood vessels, collagen and elastic fibres, glycosaminoglycans and wound contraction were performed on the scar tissue from different wounds every 7 days for 21 days. On day 7, 14 and 21, L3 and L30 showed higher collagen and glycosaminoglycan levels compared to SAL (P < 0.05). At day 21, elastic fibres were predominant in L3 and L30 compared to SAL (P < 0.05). Type-III collagen fibres were predominant at day 7 in both groups. There was gradual reduction in these fibres and accumulation of type-I collagen over time, especially in L3 and L30 compared with SAL. Elevated density of blood vessels was seen in L30 on days 7 and 14 compared to the other groups (P < 0.05). On these same days, there was higher tissue cellularity in L3 compared with SAL (P < 0.05). The progression of wound closure during all time points investigated was higher in the L30 group (P < 0.05). Both energy densities investigated increased the tissue cellularity, vascular density, collagen and elastic fibres, and glycosaminoglycan synthesis, with the greater benefits for wound closure being found at the density of 30 J/cm2.
Keywords: laser photobiostimulation, morphology, pathology, skin repair, wound healing, collagen
Laser photobiostimulation has been used as a non-invasive alternative to treat muscle injuries and skin wounds, and to control inflammatory processes and pain (Enwemeka et al. 2004; Reddy 2004). Although the use of laser light to accelerate the healing process was documented in the literature for the first time in 1971 (Mester et al. 1971; Shields & O'Kane 1994), and the efficacy of this therapeutic modality is proven, parameters about how it is used are still controversial (Tuner & Hode 1998; Moore et al. 2005). Parameters such as the type and source of laser light emission, number of applications, duration of treatment and mechanisms of action through which the laser light exerts its effects remain the focus of investigation in the ongoing search for efficient methodologies that justify and encourage the use of laser light in clinical practice. Several mechanisms have been proposed to explain the effects of laser light on biological tissues, including the absorption of light by the enzymes of the electron transport chain in the inner mitochondrial membrane, stimulation of the production of oxygen, and cell proliferation induced by photoactivation of the calcium channels (Shields & O'Kane 1994; Breitbart et al. 1996). Recent studies show that the main cells stimulated by laser light are macrophages and fibroblasts (Gonçalves et al. 2010a; Xavier et al. 2010). Macrophages are important cells responsible for releasing growth factors that stimulate proliferation, differentiation and synthesis of extracellular matrix components (Shields & O'Kane 1994; Reddy 2004; Gonçalves et al. 2010b). In in vitro experimental models examination of a wide range of wavelengths showed that wavelengths between 524 nm and 904 nm were related to decreased time of wound healing by stimulating fibroblast and keratinocyte differentiation, collagen production and skin neovascularization (Pogrel et al. 1997; Demidova-Rice et al. 2007).
Previous studies have shown that the gallium–arsenide laser (GaAs λ 660 nm) is able to stimulate skin wound healing in humans and laboratory animals with energy densities between 1 and 4 J/cm2 (Medrado et al. 2003; Pugliese et al. 2003; Reddy 2004). However, most of the work is restricted to investigating the effect of energy densities below 4 J/cm2, and reports on the effects of high energy densities in tissue repair are scarce and inconclusive. Thus, this study was designed to investigate the influence of laser photobiostimulation applied with different energy densities in a rat model of skin wound healing by secondary intention.
Materials and methods
Animals
Twenty-one male Wistar rats (Rattus norvegicus), 10 week old and weighing 282.12 ± 36.08 g, obtained from the Biological Sciences Center, Federal University of Viçosa, Minas Gerais, Brazil, were used in this study. During the experiment, the animals were allocated to individual cages that were cleaned daily and maintained in an environment with controlled temperature (22 ± 2 °C), light (12 h light/dark cycles) and humidity (60–70%).
Ethical approval
The experiment was conducted in accordance with International Ethical Standards for the Care and Use of Laboratory Animals and approved by the Ethics Committee for the Care and Use of Laboratory Animals of the Federal University of Viçosa (UFV; registration 005/2008).
Experimental protocol
Before the surgical wounds were made, the animals were anaesthetized using intramuscular ketamine (50 mg/kg) and xylazine (20 mg/kg). Then, trichotomy was performed on the dorsolateral region of the animals, and the area was defatted using ethyl ether (Merck®, Rio de Janeiro, Brazil) followed by the use of 70% ethanol and 10% povidone–iodine for anti-sepsis (Johnson Diversey®, Rio de Janeiro, Brazil). Three circular secondary intention wounds 10 mm in diameter were made in the dorsolateral region of the animals by removing the skin with a scalpel until the exposure of the muscle fascia. The standardized wound area was marked with a dermographic pencil and checked using an analogical pachymeter (Kingtools®, São Paulo, Brazil) (Gonçalves et al. 2013). After completion of the wounds, the animals were randomly divided into three groups with seven animals in each. Group saline (SAL, control): saline solution 0.9%; Group L3: GaAs laser (λ 660 nm, 3 J/cm2); Group L30: GaAs laser (λ 660 nm, 30 J/cm2). The laser device (Endophoton®, KLD, São Paulo, Brazil), which was previously calibrated by the manufacturer, presented an output of 20 mW, power density of 25.47 mW/cm2, visible radiation and a 0.79 cm2 circular beam. Laser light was applied transcutaneously at six equidistant points around the wound margin. The wounds were irradiated for 118.5 s in L3 to release 3 J/cm2 and 1185 s in L30 to release 30 J/cm2. The wounds were cleaned daily with 0.9% saline solution immediately before the laser application. The treatments were started immediately after the wound was made once a day for 21 days corresponding to the experiment duration.
Analysis of wound contraction
The progress of wound closure was evaluated by measuring the wound area every 7 days in digitized images with the dimensions of 320 × 240 pixels (24 bits/pixel) obtained using a digital video camera (W320, Sony, Tokyo, Japan). The wound areas were calculated by computerized planimetry using the Image Pro-Plus image analysis software program, version 4.5, (Media Cybernetics®, Silver Spring, MA, USA), previously calibrated. Wound contraction index (WCI) was calculated using the following ratio: initial area of the wound (Ao) − area on the day of measurement (Ai)/initial area of the wound (Ao) × 100 (Gonçalves et al. 2013). The third wound was selected for this analysis because the tissue from this wound was collected on the final day of the experiment (21st).
Analysis of total collagen and glycosaminoglycans
For each group, 35 histological sections 8 μm thick stained with Fast green and Sirius red were used to quantify the levels of collagen and total protein in scar tissue using a previously described spectrophotometric method (López-De León & Rojkind 1985). In this method, the maximal absorbance to the Sirius red (540 nm) and Fast green (605 nm) dyes, correspond to the amount of collagen and non-collagen proteins respectively. For each section used in the collagen analysis, a corresponding serial section was obtained, which was used in the analysis of glycosaminoglycans. The tissue content of glycosaminoglycans was determined according to a modified procedure described by Corne et al. (1974). Sections were transferred immediately to 10 ml of 0.1% (w/v) Alcian blue 8GX solution (0.16 M sucrose solution buffered with 0.05 ml sodium acetate at pH 5). After successive rinses in 10 ml of 0.25 M sucrose solution, dye adhered to the tissue was extracted with 10 ml of 0.5 M magnesium chloride, and the absorbance of the resultant solution was analysed in a spectrophotometer at 580 nm.
Stereological analysis
Tissue fragments were collected from the different wounds every 7 days. Each fragment contained tissue removed from the centre of the wound and part of the uninjured adjacent tissue that had not received laser radiation. The fragments were put into Karnovsky's solution for 24 h and processed for paraffin embedding. Semiserial 4-μm-thick vertical uniform random (VUR) sections were obtained using a rotating microtome (Leica Multicut 2045®, Reichert-Jung Products, Jena, Germany). One of every 20 sections was used to avoid repeating analysis of the same histological area. Sections mounted on histology slides were stained with haematoxylin and eosin for visualization of cells and blood vessels (Karu 2003), Verhoeff's method for elastic fibres (Verhoeff 1908) and Sirius red dye (Sirius red F3B, Mobay Chemical Co., Union, NJ, USA) for marking collagen fibres observed under polarizing microscopy (Junqueira et al. 1979). Analysis of collagen was based on the birefringence properties of the collagen fibres, because under polarization, the thick collagen fibres (type I) appear in shades of bright colour ranging from red to yellow, whereas thin reticular fibres (type III) are shown in bright green (Gonçalves et al. 2010a).
The slides were visualized, and the images captured using a BX-60® light microscope (Olympus, São Paulo, Brazil) connected with a digital camera (QColor-3®, Olympus, São Paulo, Brazil). For each wound and staining method, 10 histological sections were analysed. For each section, five images were obtained randomly with a 20× objective lens, and the cells and blood vessels were quantified in the histological area. Under each image was applied an unbiased two-dimensional test area (At) of 69 × 103 μm2 at tissue level, so that the total histological area investigated was 24 × 106 μm2. The proportion of the histological area occupied by type-I and type-III collagen fibres was determined using the Quantum® software program (Department of Soil Science, Federal University of Viçosa, Viçosa, Brazil) (Gonçalves et al. 2010a).
The volume density of cells (Vv [cells], %), blood vessels (Vv [bvs], %) and elastic fibres (Vv [elf], %) was estimated as:
 (1)
(1)
where ΣPp [cells; bvs; elf] denotes the total number of points on the cells, blood vessels or elastic fibres, and ΣPt is the total points of the test system (ΣPt = 200).
The length density of blood vessels (Lv [bvs], mm/mm3) and elastic fibres (Lv [elf], mm/mm3) was estimated as:
 (2)
(2)
where ΣQ−[bvs] denotes the total number of blood vessel or elastic fibre profiles counted in the At, and ΣP [tissue] is the total number of points on the tissue (Brüel et al., 2005).
The surface area density of blood vessels (Sv [bvs], mm2/mm3) was estimated as:
 (3)
(3)
where ΣI [bvs] denotes the total number of intersections between the cycloid arcs (here 44) and the blood vessel surface area, and l is the length of the cycloid arcs. The Image Pro-Plus 4.5® image analysis software (Media Cybernetics) was used in the stereological analysis.
Data analysis
The data were expressed as mean and standard deviation (mean ± SD). The normalcy of the data distribution was verified using the Shapiro–Wilk test. All variables investigated were subjected to the Kruskal–Wallis test for multiple comparisons. Statistical significance was established at P < 0.05. The analysis was performed using the software Sigma Stat 3.0® (Systat Software Inc., Chicago, IL, USA).
Results
There were no significant differences in total collagen and glycosaminoglycan content in the uninjured tissues from the different groups (Table 1). At all investigated time points, the groups exposed to laser photobiostimulation had higher collagen content in the scar tissue compared with SAL (P < 0.05). At day 7, the content of glycosaminoglycans was higher in both groups exposed to laser irradiation in relation to SAL group. A similar result was observed at day 14, but only the group L30 was significantly different compared with SAL. At the end of the experiment, the content of glycosaminoglycans was significantly higher in L3 compared with the other groups.
 Levels of collagen and glycosaminoglycans in scar tissue of rats receiving laser light applied with different energy densities
The analysis of collagen fibres in the uninjured tissue showed no difference in the proportion of type-I and type-III fibres between the groups. On days 14 and 21, the groups receiving laser irradiation had higher proportion of type-I collagen fibres compared with SAL, with the best results in L30 (P < 0.05). At day 21, this variable was similar in L3 and L30. Animals in L3 and L30 had a higher proportion of type-III fibres compared with SAL on days 7 and 14, with the best results in L3 (P < 0.05). At day 21, the content of type-III fibres was similar in all groups (Figure 1).
 Proportion of type-I and type-III collagen fibres in the scar tissue of rats receiving laser light applied with different energy densities. In B are shown representative photomicrographs of the scar tissue at the end of the experiment (day 21; Sirius ...
The analysis of elastic fibres in the uninjured tissue showed no difference in the proportion of volume and length of elastic fibres between the groups. On day 21, the groups receiving laser irradiation had a higher proportion of volume (Vv) and length (Lv) of elastic fibres (elf) compared with SAL (P < 0.05) (Figure 2).
 Density of volume (Vv) and length (Lv) of elastic fibres (elf) in scar tissue of rats receiving laser light applied with different energy densities. The top panels are representative photomicrographs of the scar tissue at the end of the experiment (day ...
The extent of scar tissue occupied by blood vessels is shown in Table 2. There were no significant differences in volume, length or surface densities of blood vessels in the unharmed tissues (day 0). At day 7, all these parameters were significantly higher in both groups that received laser light compared with SAL, with better results in L30 (P < 0.05). On days 14 and 21, similar results were observed in L30 compared with other groups (P < 0.05).
 Density of length (Lv) and area (Sv) of blood vessels (bvs) in scar tissue of rats receiving laser light applied with different energy densities
The results of tissue cellularity are shown in Table 3. The unharmed tissue presented similar cellularity in all groups. On days 7 and 21, the groups L3 and L30 had higher cellularity in the granulation tissue compared with SAL (P < 0.05). At day 14, there was a higher volume density of cells in L3 compared with the other groups (P < 0.05).
 Volume density (Vv [cells], %) of cells in the histological area of the scar tissue of rats receiving laser light applied with different energy densities
Figure 3 colour shows photomicrographs of skin histological sections collected in both groups investigated. The uninjured skin showed similar cellularity and blood vessel density in all groups. On days 7, 14 and 21, there was increased cell distribution in all groups, with higher cellularity in L3 and L30 compared with the SAL (Figure 3 and Table 2). On days 7 and 14, increased density of blood vessels was observed mainly in the group L30 compared with the other groups. At day 21, there was a higher density of cells and blood vessels in both groups that received laser light compared with SAL.
 Representative photomicrographs showing the distribution of cells and blood vessels in scar tissue of rats receiving laser light applied with different energy densities (H&E staining, bar = 30 μm). Tissue fragments ...
At all times investigated, the group L30 showed a significant reduction in the wound area compared with other groups (P < 0.05). At day 7, the rate of wound closure was higher in the groups receiving laser irradiation compared with SAL (P < 0.05). A high rate of wound closure was identified in SAL at the end of the experiment (day 21). Total closure of the wound was achieved in L30 by day 21, a feature not found in the other groups (Table 4 and Figure 4).
 Representative photomicrographs showing the progression of the closure of wound skin in rats receiving laser light applied with different energy densities. Tissue fragments were collected every 7 days during 21 days of treatment. SAL, 0.9% saline solution;L3, ...
 Progression of the closure of skin wounds in rats receiving laser light applied with different energy densities
Discussion
The present study investigated the effect of different energy densities of the GaAs laser on skin wound healing. Using design-based stereology and spectrophotometric methods, the results indicated that the laser photobiostimulation was able to modify the morphology of the scar tissue in a time-dependent way leading to more efficient healing.
It is widely recognized that for healing to occur properly, synthesis of extracellular matrix is required, especially collagen, a protein that provides structural support for cell proliferation and neoangiogenesis (Liu et al. 2008; Gonçalves et al. 2010a,b2010b). The results of this study showed that both groups that received laser irradiation had a higher total collagen content at all time points analysed. These findings corroborate the results found by Medrado et al. (2003) and Gonçalves et al. (2010a,b2010b), which observed a significant increase in the collagen content in scar tissue 7 days after laser irradiation of skin wounds in rats. Collagen synthesis is an event directly related to the biomechanical properties of the scar tissue. In this context, the greatest collagen content gives the scar tissue greater resistance to mechanical stresses, a characteristic essential to the maintenance of tissue integrity and to reduced susceptibility to further injury (Karu 2003; Gonçalves et al. 2010a,b2010b).
Considering the different collagen types, both irradiated groups had a higher proportion of type-I and type-III collagen fibres than the control group. Both energy densities investigated were effective in stimulating the maturation of collagen in scar tissue, and the best results were found in group L30. Although laser irradiation has influenced the total levels of collagen, it is essential to identify the types of collagen produced in scar tissue. Traditionally, the assessment of type-I and type-III fibrillar collagens has provided an important indicator of the progression of the healing process (Karu 2003; Gonçalves et al. 2010a,b2010b). In the earlier stages of cutaneous wound healing the synthesis of type-III collagen predominates and is then gradually replaced by type-I collagen fibres, thicker, resilient and the type of collagen that predominate in normal tissue (unharmed). Thus, determining the proportion of type-I collagen fibres in relation to type-III fibres allows us to evaluate the level of remodelling and maturation of scar tissue, which in turn indicates how much this tissue approximates to the tissue when it is unharmed (Reddy 2004; Mendez et al. 2004; Gonçalves et al. 2010b). Considering these characteristics, it is widely recognized that therapeutic approaches that stimulate the synthesis of type-I collagen, leading to increased collagen maturation, are potentially useful strategies in the treatment of skin injuries (Medrado et al. 2003; Pugliese et al. 2003; Gonçalves et al. 2010a,b2010b).
An additional result shown in the present study was the influence of the laser photobiostimulation on the glycosaminoglycan content in irradiated tissue. This finding indicates a transient modification of some structural polysaccharides of the extracellular matrix during the healing of skin wounds. It is believed that this event is possibly related to the development of a structural and functional support able to stimulate the cell migration and differentiation (Pierce et al. 1991; Hodde 2002; Lai et al. 2006). It is known that the content and distribution of polysaccharides molecules are important to the hydration (attraction of water molecules – solvation water) and nutrition of the granulation tissue during the development of a vascular network that would allow the progression of tissue repair (Pierce et al. 1991; Hodde 2002; Lai et al. 2006). Although the quantity and quality of non-protein and protein components of the stromal tissue are important in tissue repair, currently there is not sufficient evidence as to how the laser irradiation modulates the synthesis and secretion of polysaccharide molecules to stimulate the healing of skin wounds. As the analysis of these molecules performed in this study is not as sensitive and specific as some molecular biology techniques, we cannot yet establish how much the induction of synthesis of polysaccharides contributes to the mechanism through which the laser photobiostimulation improves the healing process. Thus, further studies are needed in this area.
In addition to the increased collagen and glycosaminoglycan content, the laser-treated groups also had a higher tissue area occupied by capillaries, with the best results in the group that received the highest energy density. Furthermore, this study confirmed previous findings (Moore et al. 2005; Houreld et al. 2010) that the laser radiation, in both low and high doses, stimulates the tissue cellularity and increases the synthesis of granulation tissue, which are aspects involved in tissue repair. These data are similar to those described by Corazza et al. (2007) and Gonçalves et al. (2010a). These authors showed the efficiency of high-energy dosages in the induction of fibroblast proliferation and neoangiogenesis. However, these findings are in contrast to previous studies that show better results in these variables with the use of low doses of energy, especially 1–4 J/cm2 (Tuner & Hode 1998; Medrado et al. 2003; Reddy 2004). A complex mechanism has been described through which the laser light stimulates the tissue repair. Studies with models of soft-tissue injuries have provided evidence that the photobiostimulation laser induces the synthesis and secretion of mitogens (Posten et al. 2005; Houreld et al. 2010; Xavier et al. 2010) such as vascular endothelial growth factor (VEGF), platelet-derived growth factor (PDGF), fibroblast growth factor (FGF) and tumour necrosis factor alpha (TNF-α) by macrophages, neutrophils, endothelial cells and fibroblasts, which stimulate the reorganization and repair of damaged tissue through the induction of proliferation, cell differentiation and neoangiogenesis (Posten et al. 2005; Houreld et al. 2010; Xavier et al. 2010).
There is sufficient evidence that the synthesis and differentiation of parenchymal and stromal components of the tissue determine the progression of the reorganization of injured tissue and the quality of the neoformed tissue (Karu 2003; Posten et al. 2005; Corazza et al. 2007; Liu et al. 2008). Thus, therapeutic interventions that stimulate the production of cellular and molecular components of the granulation tissue have been effective in promoting faster closure of wounds in soft tissues (Gonçalves et al. 2010a,b2010b; Xavier et al. 2010). In the present study, the group that received a higher dose of laser radiation (L30) showed more rapid progression of wound closure compared with other groups. These data are similar to those found by Enwemeka et al. (2004) and Moore et al. (2005), which showed the influence of various parameters of laser photobiostimulation on the tissue repair, including reduction in the wound area mainly with moderate energy densities between 19 and 24 J/cm2. In contrast, in these same studies, densities below 8.25 J/cm2 did not improve the injuries' closing time, findings that are contrary to the results of Medrado et al. (2003), Pugliese et al. (2003) and Mendez et al. (2004) that demonstrated a higher closing speed of the injured tissue at low energy densities (2–4 J/cm2), while high doses led to a delay in tissue recovery.
The findings of the present study suggest that laser photobiostimulation can modulate the process of skin wound healing in a time-dependent way. The higher energy density investigated was more effective in modifying the morphology of the parenchyma and stroma of the scar tissue and led to a faster healing. Considering the findings of this study in relation to the contradictory results of previous investigations, it is evident that additional studies are required to investigate the effects of photobiostimulation lasers with different energy densities on biological tissues, especially in relation to ultrastructural and metabolic changes of injured tissues.
Intro: This study investigates the influence of gallium-arsenide (GaAs) laser photobiostimulation applied with different energy densities on skin wound healing by secondary intention in rats. Three circular wounds, 10 mm in diameter, were made on the dorsolateral region of 21 Wistar rats weighting 282.12 ± 36.08 g. The animals were equally randomized into three groups: Group SAL, saline solution 0.9%; Group L3, laser GaAs 3 J/cm(2); Group L30, laser GaAs 30 J/cm(2). Analyses of cells, blood vessels, collagen and elastic fibres, glycosaminoglycans and wound contraction were performed on the scar tissue from different wounds every 7 days for 21 days. On day 7, 14 and 21, L3 and L30 showed higher collagen and glycosaminoglycan levels compared to SAL (P < 0.05). At day 21, elastic fibres were predominant in L3 and L30 compared to SAL (P < 0.05). Type-III collagen fibres were predominant at day 7 in both groups. There was gradual reduction in these fibres and accumulation of type-I collagen over time, especially in L3 and L30 compared with SAL. Elevated density of blood vessels was seen in L30 on days 7 and 14 compared to the other groups (P < 0.05). On these same days, there was higher tissue cellularity in L3 compared with SAL (P < 0.05). The progression of wound closure during all time points investigated was higher in the L30 group (P < 0.05). Both energy densities investigated increased the tissue cellularity, vascular density, collagen and elastic fibres, and glycosaminoglycan synthesis, with the greater benefits for wound closure being found at the density of 30 J/cm(2).
Background: This study investigates the influence of gallium-arsenide (GaAs) laser photobiostimulation applied with different energy densities on skin wound healing by secondary intention in rats. Three circular wounds, 10 mm in diameter, were made on the dorsolateral region of 21 Wistar rats weighting 282.12 ± 36.08 g. The animals were equally randomized into three groups: Group SAL, saline solution 0.9%; Group L3, laser GaAs 3 J/cm(2); Group L30, laser GaAs 30 J/cm(2). Analyses of cells, blood vessels, collagen and elastic fibres, glycosaminoglycans and wound contraction were performed on the scar tissue from different wounds every 7 days for 21 days. On day 7, 14 and 21, L3 and L30 showed higher collagen and glycosaminoglycan levels compared to SAL (P < 0.05). At day 21, elastic fibres were predominant in L3 and L30 compared to SAL (P < 0.05). Type-III collagen fibres were predominant at day 7 in both groups. There was gradual reduction in these fibres and accumulation of type-I collagen over time, especially in L3 and L30 compared with SAL. Elevated density of blood vessels was seen in L30 on days 7 and 14 compared to the other groups (P < 0.05). On these same days, there was higher tissue cellularity in L3 compared with SAL (P < 0.05). The progression of wound closure during all time points investigated was higher in the L30 group (P < 0.05). Both energy densities investigated increased the tissue cellularity, vascular density, collagen and elastic fibres, and glycosaminoglycan synthesis, with the greater benefits for wound closure being found at the density of 30 J/cm(2).
Abstract: Abstract
This study investigates the influence of gallium-arsenide (GaAs) laser photobiostimulation applied with different energy densities on skin wound healing by secondary intention in rats. Three circular wounds, 10 mm in diameter, were made on the dorsolateral region of 21 Wistar rats weighting 282.12 ± 36.08 g. The animals were equally randomized into three groups: Group SAL, saline solution 0.9%; Group L3, laser GaAs 3 J/cm(2); Group L30, laser GaAs 30 J/cm(2). Analyses of cells, blood vessels, collagen and elastic fibres, glycosaminoglycans and wound contraction were performed on the scar tissue from different wounds every 7 days for 21 days. On day 7, 14 and 21, L3 and L30 showed higher collagen and glycosaminoglycan levels compared to SAL (P < 0.05). At day 21, elastic fibres were predominant in L3 and L30 compared to SAL (P < 0.05). Type-III collagen fibres were predominant at day 7 in both groups. There was gradual reduction in these fibres and accumulation of type-I collagen over time, especially in L3 and L30 compared with SAL. Elevated density of blood vessels was seen in L30 on days 7 and 14 compared to the other groups (P < 0.05). On these same days, there was higher tissue cellularity in L3 compared with SAL (P < 0.05). The progression of wound closure during all time points investigated was higher in the L30 group (P < 0.05). Both energy densities investigated increased the tissue cellularity, vascular density, collagen and elastic fibres, and glycosaminoglycan synthesis, with the greater benefits for wound closure being found at the density of 30 J/cm(2).
Methods: 2013 The Authors. International Journal of Experimental Pathology © 2013 International Journal of Experimental Pathology.
Conclusions: The present study investigated the effect of different energy densities of the GaAs laser on skin wound healing. Using design-based stereology and spectrophotometric methods, the results indicated that the laser photobiostimulation was able to modify the morphology of the scar tissue in a time-dependent way leading to more efficient healing.
It is widely recognized that for healing to occur properly, synthesis of extracellular matrix is required, especially collagen, a protein that provides structural support for cell proliferation and neoangiogenesis (Liu et?al. 2008; Gonçalves et?al. 2010a,b2010b). The results of this study showed that both groups that received laser irradiation had a higher total collagen content at all time points analysed. These findings corroborate the results found by Medrado et?al. (2003) and Gonçalves et?al. (2010a,b2010b), which observed a significant increase in the collagen content in scar tissue 7?days after laser irradiation of skin wounds in rats. Collagen synthesis is an event directly related to the biomechanical properties of the scar tissue. In this context, the greatest collagen content gives the scar tissue greater resistance to mechanical stresses, a characteristic essential to the maintenance of tissue integrity and to reduced susceptibility to further injury (Karu 2003; Gonçalves et?al. 2010a,b2010b).
Considering the different collagen types, both irradiated groups had a higher proportion of type-I and type-III collagen fibres than the control group. Both energy densities investigated were effective in stimulating the maturation of collagen in scar tissue, and the best results were found in group L30. Although laser irradiation has influenced the total levels of collagen, it is essential to identify the types of collagen produced in scar tissue. Traditionally, the assessment of type-I and type-III fibrillar collagens has provided an important indicator of the progression of the healing process (Karu 2003; Gonçalves et?al. 2010a,b2010b). In the earlier stages of cutaneous wound healing the synthesis of type-III collagen predominates and is then gradually replaced by type-I collagen fibres, thicker, resilient and the type of collagen that predominate in normal tissue (unharmed). Thus, determining the proportion of type-I collagen fibres in relation to type-III fibres allows us to evaluate the level of remodelling and maturation of scar tissue, which in turn indicates how much this tissue approximates to the tissue when it is unharmed (Reddy 2004; Mendez et?al. 2004; Gonçalves et?al. 2010b). Considering these characteristics, it is widely recognized that therapeutic approaches that stimulate the synthesis of type-I collagen, leading to increased collagen maturation, are potentially useful strategies in the treatment of skin injuries (Medrado et?al. 2003; Pugliese et?al. 2003; Gonçalves et?al. 2010a,b2010b).
An additional result shown in the present study was the influence of the laser photobiostimulation on the glycosaminoglycan content in irradiated tissue. This finding indicates a transient modification of some structural polysaccharides of the extracellular matrix during the healing of skin wounds. It is believed that this event is possibly related to the development of a structural and functional support able to stimulate the cell migration and differentiation (Pierce et?al. 1991; Hodde 2002; Lai et?al. 2006). It is known that the content and distribution of polysaccharides molecules are important to the hydration (attraction of water molecules – solvation water) and nutrition of the granulation tissue during the development of a vascular network that would allow the progression of tissue repair (Pierce et?al. 1991; Hodde 2002; Lai et?al. 2006). Although the quantity and quality of non-protein and protein components of the stromal tissue are important in tissue repair, currently there is not sufficient evidence as to how the laser irradiation modulates the synthesis and secretion of polysaccharide molecules to stimulate the healing of skin wounds. As the analysis of these molecules performed in this study is not as sensitive and specific as some molecular biology techniques, we cannot yet establish how much the induction of synthesis of polysaccharides contributes to the mechanism through which the laser photobiostimulation improves the healing process. Thus, further studies are needed in this area.
In addition to the increased collagen and glycosaminoglycan content, the laser-treated groups also had a higher tissue area occupied by capillaries, with the best results in the group that received the highest energy density. Furthermore, this study confirmed previous findings (Moore et?al. 2005; Houreld et?al. 2010) that the laser radiation, in both low and high doses, stimulates the tissue cellularity and increases the synthesis of granulation tissue, which are aspects involved in tissue repair. These data are similar to those described by Corazza et?al. (2007) and Gonçalves et?al. (2010a). These authors showed the efficiency of high-energy dosages in the induction of fibroblast proliferation and neoangiogenesis. However, these findings are in contrast to previous studies that show better results in these variables with the use of low doses of energy, especially 1–4?J/cm2 (Tuner & Hode 1998; Medrado et?al. 2003; Reddy 2004). A complex mechanism has been described through which the laser light stimulates the tissue repair. Studies with models of soft-tissue injuries have provided evidence that the photobiostimulation laser induces the synthesis and secretion of mitogens (Posten et?al. 2005; Houreld et?al. 2010; Xavier et?al. 2010) such as vascular endothelial growth factor (VEGF), platelet-derived growth factor (PDGF), fibroblast growth factor (FGF) and tumour necrosis factor alpha (TNF-?) by macrophages, neutrophils, endothelial cells and fibroblasts, which stimulate the reorganization and repair of damaged tissue through the induction of proliferation, cell differentiation and neoangiogenesis (Posten et?al. 2005; Houreld et?al. 2010; Xavier et?al. 2010).
There is sufficient evidence that the synthesis and differentiation of parenchymal and stromal components of the tissue determine the progression of the reorganization of injured tissue and the quality of the neoformed tissue (Karu 2003; Posten et?al. 2005; Corazza et?al. 2007; Liu et?al. 2008). Thus, therapeutic interventions that stimulate the production of cellular and molecular components of the granulation tissue have been effective in promoting faster closure of wounds in soft tissues (Gonçalves et?al. 2010a,b2010b; Xavier et?al. 2010). In the present study, the group that received a higher dose of laser radiation (L30) showed more rapid progression of wound closure compared with other groups. These data are similar to those found by Enwemeka et?al. (2004) and Moore et?al. (2005), which showed the influence of various parameters of laser photobiostimulation on the tissue repair, including reduction in the wound area mainly with moderate energy densities between 19 and 24?J/cm2. In contrast, in these same studies, densities below 8.25?J/cm2 did not improve the injuries' closing time, findings that are contrary to the results of Medrado et?al. (2003), Pugliese et?al. (2003) and Mendez et?al. (2004) that demonstrated a higher closing speed of the injured tissue at low energy densities (2–4?J/cm2), while high doses led to a delay in tissue recovery.
The findings of the present study suggest that laser photobiostimulation can modulate the process of skin wound healing in a time-dependent way. The higher energy density investigated was more effective in modifying the morphology of the parenchyma and stroma of the scar tissue and led to a faster healing. Considering the findings of this study in relation to the contradictory results of previous investigations, it is evident that additional studies are required to investigate the effects of photobiostimulation lasers with different energy densities on biological tissues, especially in relation to ultrastructural and metabolic changes of injured tissues.
Original Source: http://www.ncbi.nlm.nih.gov/pubmed/24354418
Effect of the 532nm pulsed KTP laser in the treatment of Reinke's edema.
Pitman MJ1, Lebowitz-Cooper A, Iacob C, Tan M. - Laryngoscope. 2012 Dec;122(12):2786-92. doi: 10.1002/lary.23576. Epub 2012 Aug 8. () 1163
View Resource
Intro: To evaluate the effect and safety of the 532nm Pulsed Potassium-Titanyl-Phosphate (KTP) laser in the office-based treatment of patients with Reinke's edema using objective and subjective scaled outcome measures.
Background: To evaluate the effect and safety of the 532nm Pulsed Potassium-Titanyl-Phosphate (KTP) laser in the office-based treatment of patients with Reinke's edema using objective and subjective scaled outcome measures.
Abstract: Abstract
OBJECTIVES/HYPOTHESIS:
To evaluate the effect and safety of the 532nm Pulsed Potassium-Titanyl-Phosphate (KTP) laser in the office-based treatment of patients with Reinke's edema using objective and subjective scaled outcome measures.
STUDY DESIGN:
Case Series.
SETTING:
Tertiary hospital center.
SUBJECTS:
Seven adult females undergoing in-office KTP laser treatment for Reinke's edema.
METHODS:
Participants were studied pre- and posttreatment. Vocal function was evaluated by objective aerodynamic and acoustic analysis. Subjective changes were evaluated using the GRBAS scale, Voice Handicap Index, and videostroboscopy. Histologic effects of the laser were investigated by comparing one patient treated with laser one year prior to excision, one treated with laser just prior to excision, and one control patient who underwent excision without prior laser treatment.
RESULTS:
At an average postoperative follow up of 17.8 weeks (range 5-78), maximum phonation time trended toward improvement. The median VHI score decreased from 37 to 26 (p=0.150). There was a reduction in each component of the GRBAS scoring and the median fundamental frequency increased from 162 to 186 (p=0.625). Stroboscopic findings demonstrated an intact posttreatment mucosal wave. Histologic comparison of the tissue effects of laser in three patients demonstrated changes in vocal fold vascularity but no acute or long-term damage to the overlying epithelium.
CONCLUSION:
Objective and subjective scaled measures suggest that treatment of Reinke's edema in the office with a 532nm KTP laser may result in improved voice. It appears safe with histologic preservation of the vocal fold vibratory epithelium and persistence of mucosal wave.
Copyright © 2012 The American Laryngological, Rhinological, and Otological Society, Inc.
Methods: Case Series.
Results: Tertiary hospital center.
Conclusions: Seven adult females undergoing in-office KTP laser treatment for Reinke's edema.
Original Source: http://www.ncbi.nlm.nih.gov/pubmed/22886907
Photoactivation of bone marrow mesenchymal stromal cells with diode laser: effects and mechanisms of action.
Giannelli M1, Chellini F, Sassoli C, Francini F, Pini A, Squecco R, Nosi D, Bani D, Zecchi-Orlandini S, Formigli L. - J Cell Physiol. 2013 Jan;228(1):172-81. doi: 10.1002/jcp.24119. () 1269
View Resource
Intro: Mesenchymal stromal cells (MSCs) are a promising cell candidate in tissue engineering and regenerative medicine. Their proliferative potential can be increased by low-level laser irradiation (LLLI), but the mechanisms involved remain to be clarified. With the aim of expanding the therapeutic application of LLLI to MSC therapy, in the present study we investigated the effects of 635 nm diode laser on mouse MSC proliferation and investigated the underlying cellular and molecular mechanisms, focusing the attention on the effects of laser irradiation on Notch-1 signal activation and membrane ion channel modulation. It was found that MSC proliferation was significantly enhanced after laser irradiation, as judged by time lapse videomicroscopy and EdU incorporation. This phenomenon was associated with the up-regulation and activation of Notch-1 pathway, and with increased membrane conductance through voltage-gated K(+) , BK and Kir, channels and T- and L-type Ca(2+) channels. We also showed that MSC proliferation was mainly dependent on Kir channel activity, on the basis that the cell growth and Notch-1 up-regulation were severely decreased by the pre-treatment with the channel inhibitor Ba(2+) (0.5 mM). Interestingly, the channel inhibition was also able to attenuate the stimulatory effects of diode laser on MSCs, thus providing novel evidence to expand our knowledge on the mechanisms of biostimulation after LLLI. In conclusions, our findings suggest that diode laser may be a valid approach for the preconditioning of MSCs in vitro prior cell transplantation.
Background: Mesenchymal stromal cells (MSCs) are a promising cell candidate in tissue engineering and regenerative medicine. Their proliferative potential can be increased by low-level laser irradiation (LLLI), but the mechanisms involved remain to be clarified. With the aim of expanding the therapeutic application of LLLI to MSC therapy, in the present study we investigated the effects of 635 nm diode laser on mouse MSC proliferation and investigated the underlying cellular and molecular mechanisms, focusing the attention on the effects of laser irradiation on Notch-1 signal activation and membrane ion channel modulation. It was found that MSC proliferation was significantly enhanced after laser irradiation, as judged by time lapse videomicroscopy and EdU incorporation. This phenomenon was associated with the up-regulation and activation of Notch-1 pathway, and with increased membrane conductance through voltage-gated K(+) , BK and Kir, channels and T- and L-type Ca(2+) channels. We also showed that MSC proliferation was mainly dependent on Kir channel activity, on the basis that the cell growth and Notch-1 up-regulation were severely decreased by the pre-treatment with the channel inhibitor Ba(2+) (0.5 mM). Interestingly, the channel inhibition was also able to attenuate the stimulatory effects of diode laser on MSCs, thus providing novel evidence to expand our knowledge on the mechanisms of biostimulation after LLLI. In conclusions, our findings suggest that diode laser may be a valid approach for the preconditioning of MSCs in vitro prior cell transplantation.
Abstract: Abstract
Mesenchymal stromal cells (MSCs) are a promising cell candidate in tissue engineering and regenerative medicine. Their proliferative potential can be increased by low-level laser irradiation (LLLI), but the mechanisms involved remain to be clarified. With the aim of expanding the therapeutic application of LLLI to MSC therapy, in the present study we investigated the effects of 635 nm diode laser on mouse MSC proliferation and investigated the underlying cellular and molecular mechanisms, focusing the attention on the effects of laser irradiation on Notch-1 signal activation and membrane ion channel modulation. It was found that MSC proliferation was significantly enhanced after laser irradiation, as judged by time lapse videomicroscopy and EdU incorporation. This phenomenon was associated with the up-regulation and activation of Notch-1 pathway, and with increased membrane conductance through voltage-gated K(+) , BK and Kir, channels and T- and L-type Ca(2+) channels. We also showed that MSC proliferation was mainly dependent on Kir channel activity, on the basis that the cell growth and Notch-1 up-regulation were severely decreased by the pre-treatment with the channel inhibitor Ba(2+) (0.5 mM). Interestingly, the channel inhibition was also able to attenuate the stimulatory effects of diode laser on MSCs, thus providing novel evidence to expand our knowledge on the mechanisms of biostimulation after LLLI. In conclusions, our findings suggest that diode laser may be a valid approach for the preconditioning of MSCs in vitro prior cell transplantation.
Copyright © 2012 Wiley Periodicals, Inc.
Methods: Copyright © 2012 Wiley Periodicals, Inc.
Original Source: http://www.ncbi.nlm.nih.gov/pubmed/22628164
In vivo microscopic approaches for facial melanocytic lesions after quality-switched ruby laser therapy: time-sequential imaging of melanin and melanocytes of solar lentigo in Asian skin.
Yamashita T1, Negishi K, Hariya T, Yanai M, Iikura T, Wakamatsu S. - Dermatol Surg. 2010 Jul;36(7):1138-47. doi: 10.1111/j.1524-4725.2010.01598.x. () 2005
View Resource
Intro: The quality-switched ruby laser (QSRL) has been widely used for the treatment of pigmented lesions, but clinical evaluations in most studies have been conducted on macroscopic skin color observation comparing the laser-treated skin with its nontreated surrounding area. A few investigations examined skin changes after laser therapy at a cellular level, but almost none did so noninvasively.
Background: The quality-switched ruby laser (QSRL) has been widely used for the treatment of pigmented lesions, but clinical evaluations in most studies have been conducted on macroscopic skin color observation comparing the laser-treated skin with its nontreated surrounding area. A few investigations examined skin changes after laser therapy at a cellular level, but almost none did so noninvasively.
Abstract: Abstract
BACKGROUND:
The quality-switched ruby laser (QSRL) has been widely used for the treatment of pigmented lesions, but clinical evaluations in most studies have been conducted on macroscopic skin color observation comparing the laser-treated skin with its nontreated surrounding area. A few investigations examined skin changes after laser therapy at a cellular level, but almost none did so noninvasively.
OBJECTIVE:
To elucidate the dynamic changes after QSRL irradiation of facial solar lentigo using noninvasive optical techniques.
MATERIALS AND METHODS:
Time-sequential imaging of Japanese female patients with a clinical diagnosis of solar lentigo was performed using ultraviolet photography, high-magnification videomicroscopy, and reflectance-mode confocal microscopy to examine pigmentary change after QSRL irradiation.
RESULTS:
The present study showed that remaining melanocytes were visible in the solar lentigo of all subjects when crusts peeled off, despite hardly observable skin pigmentation to the naked eye. Moreover, noninvasive confocal imaging revealed that pigmented melanocytes varied in each solar lentigo after QSRL treatment, as indicated by melanin reflection level.
CONCLUSIONS:
Optical techniques facilitate the evaluation of the in vivo dynamics of epidermal-melanocytic changes in solar lentigo after QSRL therapy and may be useful for monitoring outcomes after laser irradiation.
Methods: To elucidate the dynamic changes after QSRL irradiation of facial solar lentigo using noninvasive optical techniques.
Results: Time-sequential imaging of Japanese female patients with a clinical diagnosis of solar lentigo was performed using ultraviolet photography, high-magnification videomicroscopy, and reflectance-mode confocal microscopy to examine pigmentary change after QSRL irradiation.
Conclusions: The present study showed that remaining melanocytes were visible in the solar lentigo of all subjects when crusts peeled off, despite hardly observable skin pigmentation to the naked eye. Moreover, noninvasive confocal imaging revealed that pigmented melanocytes varied in each solar lentigo after QSRL treatment, as indicated by melanin reflection level.
Original Source: http://www.ncbi.nlm.nih.gov/pubmed/20653729
In vivo microscopic approaches for facial melanocytic lesions after quality-switched ruby laser therapy: time-sequential imaging of melanin and melanocytes of solar lentigo in Asian skin.
Yamashita T1, Negishi K, Hariya T, Yanai M, Iikura T, Wakamatsu S. - Dermatol Surg. 2010 Jul;36(7):1138-47. doi: 10.1111/j.1524-4725.2010.01598.x. () 2023
View Resource
Intro: The quality-switched ruby laser (QSRL) has been widely used for the treatment of pigmented lesions, but clinical evaluations in most studies have been conducted on macroscopic skin color observation comparing the laser-treated skin with its nontreated surrounding area. A few investigations examined skin changes after laser therapy at a cellular level, but almost none did so noninvasively.
Background: The quality-switched ruby laser (QSRL) has been widely used for the treatment of pigmented lesions, but clinical evaluations in most studies have been conducted on macroscopic skin color observation comparing the laser-treated skin with its nontreated surrounding area. A few investigations examined skin changes after laser therapy at a cellular level, but almost none did so noninvasively.
Abstract: Abstract
BACKGROUND:
The quality-switched ruby laser (QSRL) has been widely used for the treatment of pigmented lesions, but clinical evaluations in most studies have been conducted on macroscopic skin color observation comparing the laser-treated skin with its nontreated surrounding area. A few investigations examined skin changes after laser therapy at a cellular level, but almost none did so noninvasively.
OBJECTIVE:
To elucidate the dynamic changes after QSRL irradiation of facial solar lentigo using noninvasive optical techniques.
MATERIALS AND METHODS:
Time-sequential imaging of Japanese female patients with a clinical diagnosis of solar lentigo was performed using ultraviolet photography, high-magnification videomicroscopy, and reflectance-mode confocal microscopy to examine pigmentary change after QSRL irradiation.
RESULTS:
The present study showed that remaining melanocytes were visible in the solar lentigo of all subjects when crusts peeled off, despite hardly observable skin pigmentation to the naked eye. Moreover, noninvasive confocal imaging revealed that pigmented melanocytes varied in each solar lentigo after QSRL treatment, as indicated by melanin reflection level.
CONCLUSIONS:
Optical techniques facilitate the evaluation of the in vivo dynamics of epidermal-melanocytic changes in solar lentigo after QSRL therapy and may be useful for monitoring outcomes after laser irradiation.
Methods: To elucidate the dynamic changes after QSRL irradiation of facial solar lentigo using noninvasive optical techniques.
Results: Time-sequential imaging of Japanese female patients with a clinical diagnosis of solar lentigo was performed using ultraviolet photography, high-magnification videomicroscopy, and reflectance-mode confocal microscopy to examine pigmentary change after QSRL irradiation.
Conclusions: The present study showed that remaining melanocytes were visible in the solar lentigo of all subjects when crusts peeled off, despite hardly observable skin pigmentation to the naked eye. Moreover, noninvasive confocal imaging revealed that pigmented melanocytes varied in each solar lentigo after QSRL treatment, as indicated by melanin reflection level.
Original Source: http://www.ncbi.nlm.nih.gov/pubmed/20653729
Treatment of striae distensae with a TriPollar radiofrequency device: a pilot study.
Manuskiatti W1, Boonthaweeyuwat E, Varothai S. - J Dermatolog Treat. 2009;20(6):359-64. doi: 10.3109/09546630903085278. () 2241
View Resource
Intro: Striae distensae are a frequent skin condition for which treatment remains a challenge.
Background: Striae distensae are a frequent skin condition for which treatment remains a challenge.
Abstract: Abstract
BACKGROUND:
Striae distensae are a frequent skin condition for which treatment remains a challenge.
OBJECTIVES:
To determine the efficacy and safety of a TriPollar radiofrequency (RF) device for the treatment of striae in skin phototypes IV-V.
METHODS:
Seventeen females with striae received six weekly treatments with a TriPollar RF device. The participants were evaluated using standardized photographs and a UVA-light video camera at baseline, and at 1 and 6 weeks after the final treatment. Side effects of treatment were recorded at every session.
RESULTS:
At 1 week after the final treatment, 38.2% and 11.8% of the subjects were assessed to have 25-50% and 51-75% improvement of their striae, respectively. Compared with the 1-week follow-up, at the 6-week follow-up a higher percentage of the subjects were rated to have improvement of their striae. There were no significant differences in the striae surface smoothness at the 1- (p = 0.907) and 6-week (p = 0.057) follow-ups, compared with that of baseline. Twelve percent (2/17), 23% (4/17), and 65% (11/17) of the study subjects rated their satisfaction of the overall improvement as slightly satisfied, satisfied, and very satisfied, respectively. No adverse effect was reported.
CONCLUSION:
TriPollar RF appears to be a promising alternative for the treatment of striae distensae.
Methods: To determine the efficacy and safety of a TriPollar radiofrequency (RF) device for the treatment of striae in skin phototypes IV-V.
Results: Seventeen females with striae received six weekly treatments with a TriPollar RF device. The participants were evaluated using standardized photographs and a UVA-light video camera at baseline, and at 1 and 6 weeks after the final treatment. Side effects of treatment were recorded at every session.
Conclusions: At 1 week after the final treatment, 38.2% and 11.8% of the subjects were assessed to have 25-50% and 51-75% improvement of their striae, respectively. Compared with the 1-week follow-up, at the 6-week follow-up a higher percentage of the subjects were rated to have improvement of their striae. There were no significant differences in the striae surface smoothness at the 1- (p = 0.907) and 6-week (p = 0.057) follow-ups, compared with that of baseline. Twelve percent (2/17), 23% (4/17), and 65% (11/17) of the study subjects rated their satisfaction of the overall improvement as slightly satisfied, satisfied, and very satisfied, respectively. No adverse effect was reported.
Original Source: http://www.ncbi.nlm.nih.gov/pubmed/19954393
The use of low-level light for hair growth: part I.
Avram MR1, Rogers NE. - J Cosmet Laser Ther. 2009 Jun;11(2):110-7. doi: 10.1080/14764170902842531. () 2490
View Resource
Intro: Low-level laser therapy (LLLT) is a new therapy for the treatment of hair loss. It has received enormous media attention and tremendous marketing budgets from companies that sell the devices, but no independent, peer-reviewed studies have demonstrated its efficacy in this application. Here we investigate the efficacy of LLLT in enhancing hair growth.
Background: Low-level laser therapy (LLLT) is a new therapy for the treatment of hair loss. It has received enormous media attention and tremendous marketing budgets from companies that sell the devices, but no independent, peer-reviewed studies have demonstrated its efficacy in this application. Here we investigate the efficacy of LLLT in enhancing hair growth.
Abstract: Abstract
BACKGROUND AND OBJECTIVE:
Low-level laser therapy (LLLT) is a new therapy for the treatment of hair loss. It has received enormous media attention and tremendous marketing budgets from companies that sell the devices, but no independent, peer-reviewed studies have demonstrated its efficacy in this application. Here we investigate the efficacy of LLLT in enhancing hair growth.
METHODS:
A total of seven patients were exposed to LLLT twice weekly for 20 minutes each time over a period of 3-6 months. Five patients were treated for a total of 3 months and two were treated for 6 months. Videomicroscopic images were taken at baseline, 3 months, and 6 months, and analyzed for changes in vellus hair counts, terminal hair counts, and shaft diameter. Both videomicroscopic and global images underwent blinded review for evidence of subjective improvement. Patients also answered questionnaires assessing hair growth throughout the study. Neither patients nor physicians conducting the study received any financial compensation.
RESULTS:
The results indicate that on average patients had a decrease in the number of vellus hairs, an increase in the number of terminal hairs, and an increase in shaft diameter. However, paired i-testing indicated that none of these changes was statistically significant. Also, blinded evaluation of global images did not support an improvement in hair density or caliber.
CONCLUSIONS:
LLLT may be a promising treatment option for patients who do not respond to either finasteride or minoxidil, and who do not want to undergo hair transplantation. This technology appears to work better for some people than for others. Factors predicting who will most benefit are yet to be determined. Larger, longer-term placebo-controlled studies are needed to confirm these findings, and demonstrate statistical significance, or refute them altogether.
Methods: A total of seven patients were exposed to LLLT twice weekly for 20 minutes each time over a period of 3-6 months. Five patients were treated for a total of 3 months and two were treated for 6 months. Videomicroscopic images were taken at baseline, 3 months, and 6 months, and analyzed for changes in vellus hair counts, terminal hair counts, and shaft diameter. Both videomicroscopic and global images underwent blinded review for evidence of subjective improvement. Patients also answered questionnaires assessing hair growth throughout the study. Neither patients nor physicians conducting the study received any financial compensation.
Results: The results indicate that on average patients had a decrease in the number of vellus hairs, an increase in the number of terminal hairs, and an increase in shaft diameter. However, paired i-testing indicated that none of these changes was statistically significant. Also, blinded evaluation of global images did not support an improvement in hair density or caliber.
Conclusions: LLLT may be a promising treatment option for patients who do not respond to either finasteride or minoxidil, and who do not want to undergo hair transplantation. This technology appears to work better for some people than for others. Factors predicting who will most benefit are yet to be determined. Larger, longer-term placebo-controlled studies are needed to confirm these findings, and demonstrate statistical significance, or refute them altogether.
Original Source: http://www.ncbi.nlm.nih.gov/pubmed/19466643
Treatment of neck pain: noninvasive interventions: results of the Bone and Joint Decade 2000-2010 Task Force on Neck Pain and Its Associated Disorders.
Hurwitz EL1, Carragee EJ, van der Velde G, Carroll LJ, Nordin M, Guzman J, Peloso PM, Holm LW, Côté P, Hogg-Johnson S, Cassidy JD, Haldeman S. - J Manipulative Physiol Ther. 2009 Feb;32(2 Suppl):S141-75. doi: 10.1016/j.jmpt.2008.11.017. () 2565
View Resource
Intro: Best evidence synthesis.
Background: Best evidence synthesis.
Abstract: Abstract
STUDY DESIGN:
Best evidence synthesis.
OBJECTIVE:
To identify, critically appraise, and synthesize literature from 1980 through 2006 on noninvasive interventions for neck pain and its associated disorders.
SUMMARY OF BACKGROUND DATA:
No comprehensive systematic literature reviews have been published on interventions for neck pain and its associated disorders in the past decade.
METHODS:
We systematically searched Medline and screened for relevance literature published from 1980 through 2006 on the use, effectiveness, and safety of noninvasive interventions for neck pain and associated disorders. Consensus decisions were made about the scientific merit of each article; those judged to have adequate internal validity were included in our best evidence synthesis.
RESULTS:
Of the 359 invasive and noninvasive intervention articles deemed relevant, 170 (47%) were accepted as scientifically admissible, and 139 of these related to noninvasive interventions (including health care utilization, costs, and safety). For whiplash-associated disorders, there is evidence that educational videos, mobilization, and exercises appear more beneficial than usual care or physical modalities. For other neck pain, the evidence suggests that manual and supervised exercise interventions, low-level laser therapy, and perhaps acupuncture are more effective than no treatment, sham, or alternative interventions; however, none of the active treatments was clearly superior to any other in either the short- or long-term. For both whiplash-associated disorders and other neck pain without radicular symptoms, interventions that focused on regaining function as soon as possible are relatively more effective than interventions that do not have such a focus.
CONCLUSION:
Our best evidence synthesis suggests that therapies involving manual therapy and exercise are more effective than alternative strategies for patients with neck pain; this was also true of therapies which include educational interventions addressing self-efficacy. Future efforts should focus on the study of noninvasive interventions for patients with radicular symptoms and on the design and evaluation of neck pain prevention strategies.
Methods: To identify, critically appraise, and synthesize literature from 1980 through 2006 on noninvasive interventions for neck pain and its associated disorders.
Results: No comprehensive systematic literature reviews have been published on interventions for neck pain and its associated disorders in the past decade.
Conclusions: We systematically searched Medline and screened for relevance literature published from 1980 through 2006 on the use, effectiveness, and safety of noninvasive interventions for neck pain and associated disorders. Consensus decisions were made about the scientific merit of each article; those judged to have adequate internal validity were included in our best evidence synthesis.
Original Source: http://www.ncbi.nlm.nih.gov/pubmed/19251061
Cold Laser Therapy for Pain and Sports Injuries
- 2011 (Video) 4368
Demonstration of LLLT being used on a patient with a sports injury.
View Resource
Demonstration of LLLT being used on a patient with a sports injury.
video length: (6:57)
Original Source: https://www.youtube.com/watch?v=mcZwYjAt7Jk
Visualising the procedures in the influence of water on the ablation of dental hard tissue with erbium:yttrium-aluminium-garnet and erbium, chromium:yttrium-scandium-gallium-garnet laser pulses.
Mir M1, Gutknecht N, Poprawe R, Vanweersch L, Lampert F. - Lasers Med Sci. 2009 May;24(3):365-74. doi: 10.1007/s10103-008-0571-1. Epub 2008 Jul 25. () 2763
View Resource
Intro: The exact mechanism of the ablation of tooth hard tissue with most common wavelengths, which are 2,940 nm and 2,780 nm, is not yet clear. There are several different theories, but none of them has yet been established. Concepts and methods of looking at these mechanisms have been based on heat formation and transformation, and mathematical calculations evaluating the outcome of ablation, such as looking at the shape of cuts. This study provides a new concept, which is the monitoring of the direct interactions between laser light, water and enamel, with a high-speed camera. For this purpose, both the above-mentioned wavelengths were examined. Bovine anterior teeth were prepared as thin slices. Each imaged slice had a thickness close to that of the beam diameter so that the ablation effect could be shown in two dimensional pictures. The single images were extracted from the video-clips and then were animated. The following steps, explaining the ablation procedures during each pulse, were seen and reported: (1) low-output energy intensity in the first pulses that did not lead to an ablative effect; (2) bubble formation with higher output energy density; (3) the tooth surface during the pulse was covered with the plume of vapour (comparable with a cloud), and the margins of ablation on the tooth were not clear; (4) when the vapour bubble (cloud) was collapsing, an additional ablative process at the surface could be seen.
Background: The exact mechanism of the ablation of tooth hard tissue with most common wavelengths, which are 2,940 nm and 2,780 nm, is not yet clear. There are several different theories, but none of them has yet been established. Concepts and methods of looking at these mechanisms have been based on heat formation and transformation, and mathematical calculations evaluating the outcome of ablation, such as looking at the shape of cuts. This study provides a new concept, which is the monitoring of the direct interactions between laser light, water and enamel, with a high-speed camera. For this purpose, both the above-mentioned wavelengths were examined. Bovine anterior teeth were prepared as thin slices. Each imaged slice had a thickness close to that of the beam diameter so that the ablation effect could be shown in two dimensional pictures. The single images were extracted from the video-clips and then were animated. The following steps, explaining the ablation procedures during each pulse, were seen and reported: (1) low-output energy intensity in the first pulses that did not lead to an ablative effect; (2) bubble formation with higher output energy density; (3) the tooth surface during the pulse was covered with the plume of vapour (comparable with a cloud), and the margins of ablation on the tooth were not clear; (4) when the vapour bubble (cloud) was collapsing, an additional ablative process at the surface could be seen.
Abstract: Abstract
The exact mechanism of the ablation of tooth hard tissue with most common wavelengths, which are 2,940 nm and 2,780 nm, is not yet clear. There are several different theories, but none of them has yet been established. Concepts and methods of looking at these mechanisms have been based on heat formation and transformation, and mathematical calculations evaluating the outcome of ablation, such as looking at the shape of cuts. This study provides a new concept, which is the monitoring of the direct interactions between laser light, water and enamel, with a high-speed camera. For this purpose, both the above-mentioned wavelengths were examined. Bovine anterior teeth were prepared as thin slices. Each imaged slice had a thickness close to that of the beam diameter so that the ablation effect could be shown in two dimensional pictures. The single images were extracted from the video-clips and then were animated. The following steps, explaining the ablation procedures during each pulse, were seen and reported: (1) low-output energy intensity in the first pulses that did not lead to an ablative effect; (2) bubble formation with higher output energy density; (3) the tooth surface during the pulse was covered with the plume of vapour (comparable with a cloud), and the margins of ablation on the tooth were not clear; (4) when the vapour bubble (cloud) was collapsing, an additional ablative process at the surface could be seen.
Original Source: http://www.ncbi.nlm.nih.gov/pubmed/18654826
Treatment of neck pain: noninvasive interventions: results of the Bone and Joint Decade 2000-2010 Task Force on Neck Pain and Its Associated Disorders.
Hurwitz EL1, Carragee EJ, van der Velde G, Carroll LJ, Nordin M, Guzman J, Peloso PM, Holm LW, Côté P, Hogg-Johnson S, Cassidy JD, Haldeman S; Bone and Joint Decade 2000-2010 Task Force on Neck Pain and Its Associated Disorders. - Spine (Phila Pa 1976). 2008 Feb 15;33(4 Suppl):S123-52. doi: 10.1097/BRS.0b013e3181644b1d. () 2867
View Resource
Intro: Best evidence synthesis.
Background: Best evidence synthesis.
Abstract: Abstract
STUDY DESIGN:
Best evidence synthesis.
OBJECTIVE:
To identify, critically appraise, and synthesize literature from 1980 through 2006 on noninvasive interventions for neck pain and its associated disorders.
SUMMARY OF BACKGROUND DATA:
No comprehensive systematic literature reviews have been published on interventions for neck pain and its associated disorders in the past decade.
METHODS:
We systematically searched Medline and screened for relevance literature published from 1980 through 2006 on the use, effectiveness, and safety of noninvasive interventions for neck pain and associated disorders. Consensus decisions were made about the scientific merit of each article; those judged to have adequate internal validity were included in our best evidence synthesis.
RESULTS:
Of the 359 invasive and noninvasive intervention articles deemed relevant, 170 (47%) were accepted as scientifically admissible, and 139 of these related to noninvasive interventions (including health care utilization, costs, and safety). For whiplash-associated disorders, there is evidence that educational videos, mobilization, and exercises appear more beneficial than usual care or physical modalities. For other neck pain, the evidence suggests that manual and supervised exercise interventions, low-level laser therapy, and perhaps acupuncture are more effective than no treatment, sham, or alternative interventions; however, none of the active treatments was clearly superior to any other in either the short- or long-term. For both whiplash-associated disorders and other neck pain without radicular symptoms, interventions that focused on regaining function as soon as possible are relatively more effective than interventions that do not have such a focus.
CONCLUSION:
Our best evidence synthesis suggests that therapies involving manual therapy and exercise are more effective than alternative strategies for patients with neck pain; this was also true of therapies which include educational interventions addressing self-efficacy. Future efforts should focus on the study of noninvasive interventions for patients with radicular symptoms and on the design and evaluation of neck pain prevention strategies.
Methods: To identify, critically appraise, and synthesize literature from 1980 through 2006 on noninvasive interventions for neck pain and its associated disorders.
Results: No comprehensive systematic literature reviews have been published on interventions for neck pain and its associated disorders in the past decade.
Conclusions: We systematically searched Medline and screened for relevance literature published from 1980 through 2006 on the use, effectiveness, and safety of noninvasive interventions for neck pain and associated disorders. Consensus decisions were made about the scientific merit of each article; those judged to have adequate internal validity were included in our best evidence synthesis.
Original Source: http://www.ncbi.nlm.nih.gov/pubmed/18204386
Laser surgery of port wine stains using local vacuum pressure: changes in skin morphology and optical properties (Part I).
Childers MA1, Franco W, Nelson JS, Aguilar G. - Lasers Surg Med. 2007 Feb;39(2):108-17. () 3127
View Resource
Intro: In a recent case study, the use of a suction device to aid in port wine stain (PWS) laser treatments showed favorable results. It is our objective to further understand the mechanisms of vacuum-assisted laser therapy by analyzing the mechanical and optical changes of the skin and musculoskeletal tissues during the application of mild vacuum pressure from a suction cup.
Background: In a recent case study, the use of a suction device to aid in port wine stain (PWS) laser treatments showed favorable results. It is our objective to further understand the mechanisms of vacuum-assisted laser therapy by analyzing the mechanical and optical changes of the skin and musculoskeletal tissues during the application of mild vacuum pressure from a suction cup.
Abstract: Abstract
BACKGROUND AND OBJECTIVES:
In a recent case study, the use of a suction device to aid in port wine stain (PWS) laser treatments showed favorable results. It is our objective to further understand the mechanisms of vacuum-assisted laser therapy by analyzing the mechanical and optical changes of the skin and musculoskeletal tissues during the application of mild vacuum pressure from a suction cup.
STUDY DESIGN/MATERIALS AND METHODS:
A mathematical model of tissue deformation was used to determine the changes in tissue morphology that affect the underlying laser-tissue interactions, such as epidermal stretching and thinning, blood vessel dilation, and change in blood vessel depth. Video imaging experiments were used to verify the bulk tissue deformation and skin surface stretching computed by the mathematical model. Additionally, visible reflectance spectroscopy was used to determine the changes in the optical characteristics of tissue, including blood vessel dilation and epidermal absorption coefficient.
RESULTS:
At a vacuum pressure of 50 kP(a), the epidermis at the center of the suction cup was measured to stretch 4% and was calculated to be thinned approximately 6%. Blood vessels embedded in the dermis were measured to dilate up to two times their original size. However, these vessels were calculated to be displaced toward the skin surface by a very small amount, approximately 1-3 microm. The absorption coefficient of the epidermis was also measured to be reduced significantly by approximately 25% at a wavelength of 585 nm.
CONCLUSIONS:
Mild vacuum pressure applied to the skin surface causes considerable changes in the morphology and optical properties of the tissue. These changes may be used for more efficient photothermolysis of small PWS blood vessels.
(c) 2007 Wiley-Liss, Inc.
Methods: A mathematical model of tissue deformation was used to determine the changes in tissue morphology that affect the underlying laser-tissue interactions, such as epidermal stretching and thinning, blood vessel dilation, and change in blood vessel depth. Video imaging experiments were used to verify the bulk tissue deformation and skin surface stretching computed by the mathematical model. Additionally, visible reflectance spectroscopy was used to determine the changes in the optical characteristics of tissue, including blood vessel dilation and epidermal absorption coefficient.
Results: At a vacuum pressure of 50 kP(a), the epidermis at the center of the suction cup was measured to stretch 4% and was calculated to be thinned approximately 6%. Blood vessels embedded in the dermis were measured to dilate up to two times their original size. However, these vessels were calculated to be displaced toward the skin surface by a very small amount, approximately 1-3 microm. The absorption coefficient of the epidermis was also measured to be reduced significantly by approximately 25% at a wavelength of 585 nm.
Conclusions: Mild vacuum pressure applied to the skin surface causes considerable changes in the morphology and optical properties of the tissue. These changes may be used for more efficient photothermolysis of small PWS blood vessels.
Original Source: http://www.ncbi.nlm.nih.gov/pubmed/17311268
Holmium:YAG laser treatment of ureteral calculi: A 5-year experience.
Farkas A1, Péteri L, Lorincz L, Salah MA, Flaskó T, Varga A, Tóth C. - Lasers Med Sci. 2006 Sep;21(3):170-4. Epub 2006 Aug 1. () 3268
View Resource
Intro: The purpose of this study was to provide an account of the 5-year experience we have gained using holmium:yttrium-aluminium-garnet (Ho:YAG) lasertripsy in the treatment of ureteral stones. One-hundred thirty-seven transurethral ureterolithotripsies were performed in 131 patients. A Ho:YAG laser device, fibres with diameters of 360 and 550 mum, a video camera as well as semi-rigid and flexible ureterorenoscopes were used. Results showed that the direct success rates-which meant stone-free ureters on the first post-operative day-in the upper, middle and lower ureters were 84.6, 88.7 and 94.8%, respectively. The final success rates--which meant stone-free ureters 4 weeks after the operation without a second intervention--were 84.6, 96.7 and 96.7%, respectively. The pulsatile Ho:YAG laser beam fragmented all kinds of stones easily. No ureteral stricture or reflux was identified during the follow-up period. The advantages of Ho lasertripsy outweighed its disadvantages. Based on our experience, the Ho:YAG laser is one of the most effective and safest energy sources in the treatment of ureteral calculi.
Background: The purpose of this study was to provide an account of the 5-year experience we have gained using holmium:yttrium-aluminium-garnet (Ho:YAG) lasertripsy in the treatment of ureteral stones. One-hundred thirty-seven transurethral ureterolithotripsies were performed in 131 patients. A Ho:YAG laser device, fibres with diameters of 360 and 550 mum, a video camera as well as semi-rigid and flexible ureterorenoscopes were used. Results showed that the direct success rates-which meant stone-free ureters on the first post-operative day-in the upper, middle and lower ureters were 84.6, 88.7 and 94.8%, respectively. The final success rates--which meant stone-free ureters 4 weeks after the operation without a second intervention--were 84.6, 96.7 and 96.7%, respectively. The pulsatile Ho:YAG laser beam fragmented all kinds of stones easily. No ureteral stricture or reflux was identified during the follow-up period. The advantages of Ho lasertripsy outweighed its disadvantages. Based on our experience, the Ho:YAG laser is one of the most effective and safest energy sources in the treatment of ureteral calculi.
Abstract: Abstract
The purpose of this study was to provide an account of the 5-year experience we have gained using holmium:yttrium-aluminium-garnet (Ho:YAG) lasertripsy in the treatment of ureteral stones. One-hundred thirty-seven transurethral ureterolithotripsies were performed in 131 patients. A Ho:YAG laser device, fibres with diameters of 360 and 550 mum, a video camera as well as semi-rigid and flexible ureterorenoscopes were used. Results showed that the direct success rates-which meant stone-free ureters on the first post-operative day-in the upper, middle and lower ureters were 84.6, 88.7 and 94.8%, respectively. The final success rates--which meant stone-free ureters 4 weeks after the operation without a second intervention--were 84.6, 96.7 and 96.7%, respectively. The pulsatile Ho:YAG laser beam fragmented all kinds of stones easily. No ureteral stricture or reflux was identified during the follow-up period. The advantages of Ho lasertripsy outweighed its disadvantages. Based on our experience, the Ho:YAG laser is one of the most effective and safest energy sources in the treatment of ureteral calculi.
Original Source: http://www.ncbi.nlm.nih.gov/pubmed/16897107
Effect of In-Ga-Al-P diode laser irradiation on angiogenesis in partial ruptures of Achilles tendon in rats.
Salate AC1, Barbosa G, Gaspar P, Koeke PU, Parizotto NA, Benze BG, Foschiani D. - Photomed Laser Surg. 2005 Oct;23(5):470-5. () 3461
View Resource
Intro: This study was conducted to analyze the effect of different irradiances of low-level laser therapy (LLLT) on angiogenesis after partial rupture of Achilles tendon of rats.
Background: This study was conducted to analyze the effect of different irradiances of low-level laser therapy (LLLT) on angiogenesis after partial rupture of Achilles tendon of rats.
Abstract: Abstract
OBJECTIVE:
This study was conducted to analyze the effect of different irradiances of low-level laser therapy (LLLT) on angiogenesis after partial rupture of Achilles tendon of rats.
BACKGROUND DATA:
METHODS:
Ninety-six animals were divided into three groups subject to treatment during 3, 5, and 7 days post-lesion. Thirty-two animals were used in each group. The groups were further divided into four subgroups with eight animals in each, receiving In-Ga-Al-P laser (660 nm) treatment at (1) mean output of 10 mW, (2) 40 mW during 10 sec, (3) a sham subgroup, and (4) a non-treatment subgroup. Each animal was subjected to a lesion of the Achilles tendon by dropping a 186-g weight from a 20-cm height over the tendon. Treatment was initiated 6 h post-injury for all the groups. Blood vessels were colored with India ink injection and were examined in a video microscope.
RESULTS:
Laser exposure promoted an increase in blood vessel count when compared to controls. The 40-mW group showed early neovascularization, with the greatest number of microvessels after three laser applications. The 10-mW subgroup showed angiogenesis activity around the same time as the sham laser group did, but the net number of vessels was significantly higher in the former than in the controls. After seven irradiations, the subgroup receiving 40 mW experienced a drop in microvessel number, but it was still higher than in the control groups.
CONCLUSIONS:
LLLT of different intensities seems to promote neovascularization in damaged Achilles tendons of rats after partial rupture compared to controls.
Results: Ninety-six animals were divided into three groups subject to treatment during 3, 5, and 7 days post-lesion. Thirty-two animals were used in each group. The groups were further divided into four subgroups with eight animals in each, receiving In-Ga-Al-P laser (660 nm) treatment at (1) mean output of 10 mW, (2) 40 mW during 10 sec, (3) a sham subgroup, and (4) a non-treatment subgroup. Each animal was subjected to a lesion of the Achilles tendon by dropping a 186-g weight from a 20-cm height over the tendon. Treatment was initiated 6 h post-injury for all the groups. Blood vessels were colored with India ink injection and were examined in a video microscope.
Conclusions: Laser exposure promoted an increase in blood vessel count when compared to controls. The 40-mW group showed early neovascularization, with the greatest number of microvessels after three laser applications. The 10-mW subgroup showed angiogenesis activity around the same time as the sham laser group did, but the net number of vessels was significantly higher in the former than in the controls. After seven irradiations, the subgroup receiving 40 mW experienced a drop in microvessel number, but it was still higher than in the control groups.
Original Source: http://www.ncbi.nlm.nih.gov/pubmed/16262576
Effects of hypobaric pressure on human skin: implications for cryogen spray cooling (part II).
Aguilar G1, Franco W, Liu J, Svaasand LO, Nelson JS. - Lasers Surg Med. 2005 Feb;36(2):130-5. () 3648
View Resource
Intro: Clinical results have demonstrated that dark purple port wine stain (PWS) birthmarks respond favorably to laser induced photothermolysis after the first three to five treatments. Nevertheless, complete blanching is rarely achieved and the lesions stabilize at a red-pink color. In a feasibility study (Part I), we showed that local hypobaric pressure on PWS human skin prior to laser irradiation induced significant lesion blanching. The objective of the present study (Part II) is to investigate the effects of hypobaric pressures on the efficiency of cryogen spray cooling (CSC), a technique that assists laser therapy of PWS and other dermatoses.
Background: Clinical results have demonstrated that dark purple port wine stain (PWS) birthmarks respond favorably to laser induced photothermolysis after the first three to five treatments. Nevertheless, complete blanching is rarely achieved and the lesions stabilize at a red-pink color. In a feasibility study (Part I), we showed that local hypobaric pressure on PWS human skin prior to laser irradiation induced significant lesion blanching. The objective of the present study (Part II) is to investigate the effects of hypobaric pressures on the efficiency of cryogen spray cooling (CSC), a technique that assists laser therapy of PWS and other dermatoses.
Abstract: Abstract
BACKGROUND AND OBJECTIVES:
Clinical results have demonstrated that dark purple port wine stain (PWS) birthmarks respond favorably to laser induced photothermolysis after the first three to five treatments. Nevertheless, complete blanching is rarely achieved and the lesions stabilize at a red-pink color. In a feasibility study (Part I), we showed that local hypobaric pressure on PWS human skin prior to laser irradiation induced significant lesion blanching. The objective of the present study (Part II) is to investigate the effects of hypobaric pressures on the efficiency of cryogen spray cooling (CSC), a technique that assists laser therapy of PWS and other dermatoses.
STUDY DESIGN/MATERIALS AND METHODS:
Experiments were carried out within a suction cup and vacuum chamber to study the effect of hypobaric pressure on the: (1) interaction of cryogen sprays with human skin; (2) spray atomization; and (3) thermal response of a model skin phantom. A high-speed camera was used to acquire digital images of spray impingement on in vivo human skin and spray cones generated at different hypobaric pressures. Subsequently, liquid cryogen was sprayed onto a skin phantom at atmospheric and 17, 34, 51, and 68 kPa (5, 10, 15, and 20 in Hg) hypobaric pressures. A fast-response temperature sensor measured sub-surface phantom temperature as a function of time. Measurements were used to solve an inverse heat conduction problem to calculate surface temperatures, heat flux, and overall heat extraction at the skin phantom surface.
RESULTS:
Under hypobaric pressures, cryogen spurts did not produce skin indentation and only minimal frost formation. Sprays also showed shorter jet lengths and better atomization. Lower minimum surface temperatures and higher overall heat extraction from skin phantoms were reached.
CONCLUSIONS:
The combined effects of hypobaric pressure result in more efficient cryogen evaporation that enhances heat extraction and, therefore, improves the epidermal protection provided by CSC.
(c) 2005 Wiley-Liss, Inc.
Methods: Experiments were carried out within a suction cup and vacuum chamber to study the effect of hypobaric pressure on the: (1) interaction of cryogen sprays with human skin; (2) spray atomization; and (3) thermal response of a model skin phantom. A high-speed camera was used to acquire digital images of spray impingement on in vivo human skin and spray cones generated at different hypobaric pressures. Subsequently, liquid cryogen was sprayed onto a skin phantom at atmospheric and 17, 34, 51, and 68 kPa (5, 10, 15, and 20 in Hg) hypobaric pressures. A fast-response temperature sensor measured sub-surface phantom temperature as a function of time. Measurements were used to solve an inverse heat conduction problem to calculate surface temperatures, heat flux, and overall heat extraction at the skin phantom surface.
Results: Under hypobaric pressures, cryogen spurts did not produce skin indentation and only minimal frost formation. Sprays also showed shorter jet lengths and better atomization. Lower minimum surface temperatures and higher overall heat extraction from skin phantoms were reached.
Conclusions: The combined effects of hypobaric pressure result in more efficient cryogen evaporation that enhances heat extraction and, therefore, improves the epidermal protection provided by CSC.
Original Source: http://www.ncbi.nlm.nih.gov/pubmed/15704166
Combined photodynamic and photothermal induced injury enhances damage to in vivo model blood vessels.
Kelly KM1, Kimel S, Smith T, Stacy A, Hammer-Wilson MJ, Svaasand LO, Nelson JS. - Lasers Surg Med. 2004;34(5):407-13. () 3773
View Resource
Intro: The degree of port wine stain (PWS) blanching following pulsed dye laser (PDL) therapy remains variable and unpredictable. Because of the limitations of current PDL therapy, alternative treatment approaches should be explored. The objective was to evaluate a novel methodology for selective vascular damage, combined photodynamic (PDT) and photothermal (PDL) treatment, using the in vivo chick chorioallantoic membrane (CAM) model.
Background: The degree of port wine stain (PWS) blanching following pulsed dye laser (PDL) therapy remains variable and unpredictable. Because of the limitations of current PDL therapy, alternative treatment approaches should be explored. The objective was to evaluate a novel methodology for selective vascular damage, combined photodynamic (PDT) and photothermal (PDL) treatment, using the in vivo chick chorioallantoic membrane (CAM) model.
Abstract: Abstract
BACKGROUND AND OBJECTIVES:
The degree of port wine stain (PWS) blanching following pulsed dye laser (PDL) therapy remains variable and unpredictable. Because of the limitations of current PDL therapy, alternative treatment approaches should be explored. The objective was to evaluate a novel methodology for selective vascular damage, combined photodynamic (PDT) and photothermal (PDL) treatment, using the in vivo chick chorioallantoic membrane (CAM) model.
STUDY DESIGN/MATERIALS AND METHODS:
Thirty microliters of benzoporphyrin derivative monoacid ring A (BPD) solution was administered intraperitoneally into chick embryos at day 12 of development. Study groups were: (1) control (no BPD, no light); (2) BPD alone; (3) continuous wave irradiation (CW) alone (576 nm, 60 mW/cm2, 125 seconds); (4) CW + PDL; (5) BPD+PDL; (6) PDT (BPD+CW); (7) PDL alone (585 nm, 4 J/cm(2)); and (8) PDT+PDL (BPD + CW followed immediately by PDL). Vessels were videotaped prior to, and at 1 hour post-intervention and then assessed for damage based on the following scale: 0, no damage; 1, coagulation; 1.5, vasoconstriction; 2.0, coagulation+vasoconstriction; 2.5, angiostasis; 3.0, hemorrhage. Damage scores were weighted by vessel "order."
RESULTS:
PDT + PDL resulted in significantly (P < 0.01) more severe vascular damage than was observed in any other study group: 127% more than PDT, 47% more than PDL alone.
CONCLUSIONS:
PDT + PDL is a novel and promising approach for selective vascular damage and may offer a more effective method for treatment of PWS and other vascular skin lesions.
Copyright 2004 Wiley-Liss, Inc.
Methods: Thirty microliters of benzoporphyrin derivative monoacid ring A (BPD) solution was administered intraperitoneally into chick embryos at day 12 of development. Study groups were: (1) control (no BPD, no light); (2) BPD alone; (3) continuous wave irradiation (CW) alone (576 nm, 60 mW/cm2, 125 seconds); (4) CW + PDL; (5) BPD+PDL; (6) PDT (BPD+CW); (7) PDL alone (585 nm, 4 J/cm(2)); and (8) PDT+PDL (BPD + CW followed immediately by PDL). Vessels were videotaped prior to, and at 1 hour post-intervention and then assessed for damage based on the following scale: 0, no damage; 1, coagulation; 1.5, vasoconstriction; 2.0, coagulation+vasoconstriction; 2.5, angiostasis; 3.0, hemorrhage. Damage scores were weighted by vessel "order."
Results: PDT + PDL resulted in significantly (P < 0.01) more severe vascular damage than was observed in any other study group: 127% more than PDT, 47% more than PDL alone.
Conclusions: PDT + PDL is a novel and promising approach for selective vascular damage and may offer a more effective method for treatment of PWS and other vascular skin lesions.
Original Source: http://www.ncbi.nlm.nih.gov/pubmed/15216534
Evaluation of c-erbB-2 overexpression and Her-2/neu gene copy number heterogeneity in Barrett's adenocarcinoma.
Walch A1, Bink K, Gais P, Stangl S, Hutzler P, Aubele M, Mueller J, Höfler H, Werner M. - Anal Cell Pathol. 2000;20(1):25-32. () 4217
View Resource
Intro: Amplification of the Her-2/neu gene is accompanied by overexpression of its cell surface receptor product, c-erbB-2 protein. To investigate the degree of intratumoural heterogeneity we applied immunohistochemistry in primary Barrett's adenocarcinoma (BCA) (n = 6) and dysplasia adjacent to the carcinoma (n = 4). In addition, fluorescence in situ hybridisation (FISH) was performed in primary BCA (n = 5) and dysplastic areas (n = 4). For an objective evaluation digital image analysis and laser scanning microscopy were used. Five of six BCA showed a marked intratumoral heterogeneous staining pattern ranging from areas in which the tumour cells were negative or faintly positive to tumour areas with a strong staining of the entire membrane. Among the two dysplastic areas also a heterogeneous staining pattern was observed. FISH analysis revealed marked heterogeneity of intratumoral gene copy number changes in all BCA showing populations with different fractions of cells with polysomy, low level amplification and high level amplification. One dysplasia showed a minor population with Her-2/neu signal clusters. In conclusion, we observed marked intratumoural heterogeneity of c-erbB-2 protein overexpression and Her-2/neu gene copy number in the majority of the primary BCA analyzed. Digital image analysis and laser scanning microscopy were helpful in quantifying the variations in protein expression and DNA copy number in individual tumour cells. The observed heterogeneity could hamper the exact diagnostic determination of the c-erbB-2 status in small biopsies and possibly influence the effectiveness of a potential c-erbB-2 targeting therapy. Figures on http://www.esacp.org/acp/2000/20-1/walch.htm+ ++.
Background: Amplification of the Her-2/neu gene is accompanied by overexpression of its cell surface receptor product, c-erbB-2 protein. To investigate the degree of intratumoural heterogeneity we applied immunohistochemistry in primary Barrett's adenocarcinoma (BCA) (n = 6) and dysplasia adjacent to the carcinoma (n = 4). In addition, fluorescence in situ hybridisation (FISH) was performed in primary BCA (n = 5) and dysplastic areas (n = 4). For an objective evaluation digital image analysis and laser scanning microscopy were used. Five of six BCA showed a marked intratumoral heterogeneous staining pattern ranging from areas in which the tumour cells were negative or faintly positive to tumour areas with a strong staining of the entire membrane. Among the two dysplastic areas also a heterogeneous staining pattern was observed. FISH analysis revealed marked heterogeneity of intratumoral gene copy number changes in all BCA showing populations with different fractions of cells with polysomy, low level amplification and high level amplification. One dysplasia showed a minor population with Her-2/neu signal clusters. In conclusion, we observed marked intratumoural heterogeneity of c-erbB-2 protein overexpression and Her-2/neu gene copy number in the majority of the primary BCA analyzed. Digital image analysis and laser scanning microscopy were helpful in quantifying the variations in protein expression and DNA copy number in individual tumour cells. The observed heterogeneity could hamper the exact diagnostic determination of the c-erbB-2 status in small biopsies and possibly influence the effectiveness of a potential c-erbB-2 targeting therapy. Figures on http://www.esacp.org/acp/2000/20-1/walch.htm+ ++.
Abstract: Abstract
Amplification of the Her-2/neu gene is accompanied by overexpression of its cell surface receptor product, c-erbB-2 protein. To investigate the degree of intratumoural heterogeneity we applied immunohistochemistry in primary Barrett's adenocarcinoma (BCA) (n = 6) and dysplasia adjacent to the carcinoma (n = 4). In addition, fluorescence in situ hybridisation (FISH) was performed in primary BCA (n = 5) and dysplastic areas (n = 4). For an objective evaluation digital image analysis and laser scanning microscopy were used. Five of six BCA showed a marked intratumoral heterogeneous staining pattern ranging from areas in which the tumour cells were negative or faintly positive to tumour areas with a strong staining of the entire membrane. Among the two dysplastic areas also a heterogeneous staining pattern was observed. FISH analysis revealed marked heterogeneity of intratumoral gene copy number changes in all BCA showing populations with different fractions of cells with polysomy, low level amplification and high level amplification. One dysplasia showed a minor population with Her-2/neu signal clusters. In conclusion, we observed marked intratumoural heterogeneity of c-erbB-2 protein overexpression and Her-2/neu gene copy number in the majority of the primary BCA analyzed. Digital image analysis and laser scanning microscopy were helpful in quantifying the variations in protein expression and DNA copy number in individual tumour cells. The observed heterogeneity could hamper the exact diagnostic determination of the c-erbB-2 status in small biopsies and possibly influence the effectiveness of a potential c-erbB-2 targeting therapy. Figures on http://www.esacp.org/acp/2000/20-1/walch.htm+ ++.
Original Source: http://www.ncbi.nlm.nih.gov/pubmed/11007435
Super Pulsed Laser, LED, LLLT (Cold Laser), Super Luminous Diode (SLD/LED/light cluster), IR McVay
- 2012 (Video) 4345
This video gives a basic description of LLLT and shows a simple procedure
View Resource
This video gives a short description of how LLLT works, and shows the most basic procedure for using a laser for therapy. It also explains some of the differences between differnt types of lasers, and talks about penetratin depth.
video length: (2:22)
Original Source: https://www.youtube.com/watch?v=uqBSBs-Vvqc
LLLT Kahn News clips
- (Video) 4350
This is a 14 minute long video compilation of news reports about LLLT
View Resource
This is a compilation of news reports from the early 2000's about LLLT being used in a Canadian clinic primarily for atheletes.
video length: (13:47)
Original Source: https://www.youtube.com/watch?v=-cFNMak6hOA
LLLT - CB Therapy Solutions Toronto
- 2016 (Video) 4356
Therapist discuses the basics of LLLT while giving a basic demonstration of LLLT
View Resource
Therapist discuses the basics of LLLT while giving a basic demonstration of LLLT.
video length: (1:56)
Original Source: https://www.youtube.com/watch?v=goYk_I4gxaI
THOR LLLT treatment of sports injuries
- 2008 (Video) 4363
LLLT used on sports injury, video was posted by thor, could be biased
View Resource
LLLT used on sports injury.
video length: (0:41)
Original Source: https://www.youtube.com/watch?v=z7OSDnANwqA
Dentist, Mark Dincher talks about his use of LLLT (sorry for the noisy environment)
- (Video) 4364
Dentist describes his experience using LLLT on patients, video posted by thor, may be biased
View Resource
Dentist describes his experience using LLLT on patients.
video length: (3:57)
Original Source: https://www.youtube.com/watch?v=pqhzwEWLMTA
Rio's Recovery with Laser Therapy - 2 Years Later
- (Video) 4371
Video of a horse who is near euthanasia receives LLLT and is able to maintain the use of it's legs
View Resource
2 IA steroid injections + Hyaluronic Acid, systemic NSAID's, and chiropractic were administered, and joint support supplement was added to Rio's feed - with no improvement noted. Laser therapy was tried as a last resort prior to euthanasia. 15,000 total Joules were applied to Rio's left elbow and left shoulder. Over a year and a half later Rio is going strong
video length: (2:55)
Original Source: https://www.youtube.com/watch?v=_3Sneef0fe0&nohtml5=False
TerraQuant Laser Therapy Equipment & Cold Laser Healing
- (Video) 4379
made about terraquant, possible bias
View Resource
Informational video on LLLT, that turns into an ad at around (2:45) for terraquant.
video length: (7:06)
Original Source: https://www.youtube.com/watch?v=mvSOxHJNFXw&nohtml5=False
Chiropractic Care Services & Treatments : Flexor Withdrawal Reflex Cold Laser Therapy Demonstration
- 2008 (Video) 4384
Dr. Minors demonstrates increased flexibility after LLLT
View Resource
See a flexor withdrawal reflex cold laser therapy demonstration for chiropractic care in this free health care video.
video length: (4:28)
Original Source: https://www.youtube.com/watch?v=nHjlyLHd03w&nohtml5=False
Low Level Laser Therapy (LLLT) - Australian Laser & Skin Clinics
- 2013 (Video) 4386
This is an introductory video to LLLT, it was made bu a chiropractic clinic, so it may be biased
View Resource
LLLT works by using light to stimulate, regulate and accelerate cell function in the area being treated in order to heal, restore and improve damaged tissue.
LLLT can be treated on any part of the body and restores injured tissue to return to a normal level in both structure and function, which alleviates symptoms that include swelling, redness, damaged skin, and pain.
video length: (1:47)
Original Source: https://www.youtube.com/watch?v=x6I0DGHTKaQ&nohtml5=False
See the benefits of Cold laser Therapy
- 2008 (Video) 4391
This video gives a simple description of LLLT, however the laser is used through clothing for demo purposes this would not be the case in actual LLLT
View Resource
This video gives a simple description of LLLT, however the laser is used through clothing for demo purposes this would not be the case in actual LLLT.
video length: (2:22)
Original Source: https://www.youtube.com/watch?v=MD9-M-cN0_I&nohtml5=False
Cold Laser Therapy Hip Replacement Arthritis Pain Dr Paul Teich
- 2015 (Video) 4395
A woman tells of her experience with LLLT
Wounded tiger gets THOR LLLT / Low Level Laser Therapy treatment
- 2012 (Video) 4353
2 videos of a tiger receiving LLLT, one video shows them giving LLLT to the tiger's eye, do NOT point any lights or lasers into your eye, it was also made by thor, so it could be biased
View Resource
Two videos of a tiger recieving LLLT on a wound and on it's eye, tiger does't seem to be in pain, but the videos simply don't show enough to make any real claims.
video length: (0:40)
Tiger's eye gets THOR LLLT / Low Level Laser Therapy treatment
video length: (0:39)
Original Source: https://www.youtube.com/watch?v=FB5AykoLngo
Grizzly bear gets THOR LLLT / Low Level Laser Therapy treatment for Osteoarthritis
- 2012 (Video) 4355
Grizzly Bear recieving LLLT for it's osteoarthritis of the hip, video made by thor, so it could be biased.
View Resource
Grizzly Bear recieving LLLT for it's osteoarthritis of the hip.
video length: (0:54)
Alternative Carpal Tunnel Treatment. National News report on Microlight ML830® Cold Laser Therapy
- 2011 (Video) 4390
This is a news report on a patient with Carpal Tunnel Syndrome who receives LLLT treatment, the video was posted by microlight, it may be biased
View Resource
Action News reports on the use of LLLT for relief from Carpal Tunnel Syndrome. LLLT provides relief from pain and inflammation, migraines, arthritis, fibromyalgia, back pain, neck pain, muscle injuries, ligament injuries, and many more.
video length: (3:02)
Original Source: https://www.youtube.com/watch?v=bRe5U4sO4t4&nohtml5=False
THOR LLLT Cold Laser Therapy for Horses Equine THOR Photomedicine Ltd
- 20008 (Video) 4378
Video demonstration of LLLT on a horse, video made by thor, so it may be biased
View Resource
Anna Johnson is the British 3 Day Olympic team equine physio. Here she demonstrates the THOR laser system for pain relief and tissue healing.
video length: (4:51)
Original Source: https://www.youtube.com/watch?v=hC5CTON4G4Q&nohtml5=False
Cold Laser Therapy & Smoking Cessation
- 2015 (Video) 4388
3 physical therapists discuss LLLT's efficacy in trying to quit smoking, They speak specifically about theralase, so it could be biased
View Resource
In this video three physical therapists talk about using LLLT for pain management and for smoking cessation.
video length: (3:24)
Original Source: https://www.youtube.com/watch?v=mdGNAI5mMCA&nohtml5=False
THOR LLLT in California
- 2010 (Video) 4360
There is a small amount of info on LLLT in this video, but it's essentially an ad for thor/physical therapy
View Resource
This is essentially an ad for thor, and the physical therapy clinic mentioned, but it still contains a small amount of information on LLLT
video length: (2:00)
Original Source: https://www.youtube.com/watch?v=of1DKWTpcaA
Low Level Laser Therapy For Treating Back Pain
- 2015 (Video) 4392
This is an Australian news report on LLLT.
View Resource
LLLT also known as cold laser was featured on Channel 7 News with Dr Roberta Chow using low level laser to treat back pain
video length: (2:06)
Original Source: https://www.youtube.com/watch?v=GPk5HxzF_kY&nohtml5=False
North Dallas and Plano Chiropractor Discusses Cold Laser Therapy
- 2011 (Video) 4380
possible bias
View Resource
This video shows North Dallas and Plano chiropractor, Dr. Khayal, demonstrating the use of cold laser therapy, sometimes known as "cold light laser". Premier Health Chiropractic employs cold laser therapy as a part of its patients healing and recovery process, along with other chiropractic technologies such as the ProAdjuster and spinal decompression.
video length: (2:02)
Original Source: https://www.youtube.com/watch?v=gpdY13Xazgc&nohtml5=False
cold laser therapy Miami
- 2016 (Video) 4389
This is an animated ad for a Florida Chiropractic Clinic, but it does have a small amount of info on LLLT.
LLLT : Anybeam(Dental laser): Three in One dental laser, One Er:Yag(2940nm), Two Nd:Yags(1064nm, 1320nm)
- 2008 (Video) 4349
specific laser used, possible bias (graphic content)
View Resource
Video of a LLLT procedure on a dental pateint.
video length: (1:56)
Original Source: https://www.youtube.com/watch?v=RrJCCnsqN1w
Pain Relief with Microlight ML 830® Cold Laser Therapy - News Reports - Natural Pain Relief
- 2011 (Video) 4377
made by microlight, possible bias
View Resource
Fox News 10 reports on the Microlight ML830® Cold Laser used for all types of pain relief.
video length: (4:58)
Dr. Sam Lam Talks About the Capillus Low Level Laser Therapy (LLLT) for Hair Loss
- 2014 (Video) 4351
made by capillus, Ad
View Resource
Dr. Sam Lam talks about a laser therapy device for hairloss, it is basically an ad, so be mindful of that.
video length: (3:25)
Original Source: https://www.youtube.com/watch?v=7u6wwHCBlbQ
Cold Laser Therapy LLLT Quantum Healing Lasers
- 2010 (Video) 4338
main speaker sells lasers, may be biased
View Resource
this video talks about the benificial effects of LLLT on all cells that are injured or ailing:
- Brain cells
- Skin cells
- Bone cells
- Nerve cells
It also states that LLLT has no effect on cells that don't need energy.
video length: (7:26)
Original Source: https://www.youtube.com/watch?v=KUJinXH5tr4
How Cold Laser Therapy Works
- 2008 (Video) 4397
This is a short video description of LLLT, along with some history of LLLT. The video is produced by the founder of scalar wave lasers, which makes many magical claims.
View Resource
Lasers as a medicinal tool have been researched ever since their discovery forty years ago. LASER is the acronym for Light Amplification by Stimulated Emission of Radiation. Albert Einstein was the first person to discover the presence of laser; however it was Theodre Maiman who invented the first working ruby laser. He managed to produce a red colored laser from ruby crystal which was so intense that it could bore through several layers of stacked razor metals. The laser produced was powerful but short-lived. Since then much research has taken place in this area.
Low level lasers are characterized by low intensity levels and were used by Endre Mester, a Hungarian scientist in his medical research and he presented the paper on utility of Low level lasers in medicine in 1969. This resulted in astounding discoveries -- laser beams relieved patients from pain, hastened recuperation, and drastically cut down marks and blemishes.
LLLT- The Science behind It
The photons, carriers of electromagnetic radiations, an inherent component of all wavelengths of light activate the multifunctional nucleotide, ATP. ATP (Adenosine Triphosphate) contain high energy phosphate bonds which transport energy to cells for biochemical processes including muscular contraction and enzymatic metabolism, thereby restoring the normal enzymatic balance and energy levels. This, in a radical but natural manner, accelerates the healing process.
LLLT is characterized by typical LASER attributes of coherence, polarization and monochromaticity. They are narrow and shiny beams which can penetrate and be easily assimilated by the body. Low level LASERs have a specific wavelength range. The frequency of light is given by the movement of light moving upward and downward.
How It Works
Low level laser therapy works in a similar manner to the photosynthesis in plants where the sun's energy is used by the plants which initiate crucial cellular processes hastening the cell production and rejuvenating processes of the plant cells.
In the similar way, the photons of LLT reach the human body. While the body can be compared to the plant, the low level laser light is similar to the sun light. Once absorbed, the LASER activates the cell metabolism and cell reconstruction. The Low Level Laser Therapy rays are capable of boring 3 inches deep into the body. These rays insert bio photons into the damaged and the living cells. These cells start producing ATP improving their function, strengthening the body resistance by producing collagen, enzymes thereby improving the synthesis of various hormones. These substances are basic for the healthy functioning of the body cells. Hence the tissues are healed and pain disappears.
With photons as the driving force, the Low Level Laser is the silent healer of wounds, pains and dermatological disorders. It is established beyond doubt that unlike other drug or therapy, Low Level Laser Therapy has no peripheral or undesirable secondary effect. A laser is critical in revitalizing the impaired or injured cells by improving the resistance or immunity. Low Level Laser Therapy will go a long way in medical history and it has come to a stay.
video length: (4:00)
Original Source: https://www.youtube.com/watch?v=v9fHMR94t_I
M6 Cold Laser Therapy for Knee Pain
- 2015 (Video) 4375
Advertisement
View Resource
Advertisement that at least shows LLLT being used on patients.
video length: (2:09)
(LLLT) Low Level Laser Therapy - The Drs TV SHOW
The Doctors - (Video) 4335
TV show excerpt with obvious ad at the end
View Resource
This video is not exactly the autority on LLLT, it does show some results in the use of LLLT in hairloss at (6:24); however it has a shameless hairloss clinic plug at the end, so take it with a grain of salt.
video length: (7:55)
Original Source: https://www.youtube.com/watch?v=bm4KhRTsUlY
Home Search Introduction
Ken Teegardin - (Website) 4361
View Resource
This tool is a searchable collection of technical publications, books, videos and other resources about the use of lasers and light for PhotoBioModulation (PBM). Enter a keyword above or see some of our favorite queries below.
Here are some of our favorite queries:
- Information for Beginners
- Best wavelength for PBM (980nm vs. 810nm vs 660nm...)
- Compare Lasers and LEDs
- Pulsing versus Continuous Wave (CW)
- Dosage: The best practices for dosage
- How NOT to promote laser therapy (by Turner and Hode)
- Great summary of positive double blind studies
- Whole Body Systems
- See all videos
- See all books about laser therapy and cold lasers
- Testimonials
- Amazing results
- Video testimonials from patients
- Video testimonials from doctors
- Incredible results in animals
- Increasing Athletic Performance
- Research Info for other Applications
- Stem cell production in laser therapy
- Cosmetic and skin therapy parameters
- Intro to laser acupuncture
- Traumatic brain injury research
- Soft Tissue
- Autoimmune
- Lyme's Disease
- Parkinson's research
- Alzheimer's research
- Hashimoto's research
- Covid
- Contraindications
- LLLT and Cancer
All the resources include links to the original source so we are not making any statement about the use of lasers for treating non-FDA cleared application, we are simple summarizing what others have said.
Where every possible, we have included a link to the orginal publication.
This tool uses a broad match query so:
- It does not correct spelling and searches only cold laser related subjects so do not use LLLT, cold or laser in the search bar
- It works better with shorter search terms or even parts of search terms
- It searches all the available fields so you can enter a body part, author, condition or laser brand.
- Where ever possible, the detailed section about the resource will link to the sources.
- This system is only for photobiomodulation or cold laser therapy research (including LLLT, laser acupuncture and high power laser therapy) only. It does NOT include photodynamic laser therapy (where the laser is used to react with a pharmaceutical), hot surgery lasers or cosmetic lasers. It does include some resources on weight loss and smoking cessation.
The results of the search are sorted based on 3 quality factors on a scale of 1 to 10 with 10 being the best score. Originally all the resources were given a 5-5-5 until they could be individually evaluated. These scores are purely opinion and are only used to simplify the rank of the results from more valuable to least valuable. This should not be considered a critique of any work. This system was created to help researchers (including ourselves) find the most usable resources for any cold laser therapy research. The resources are assigned values based on the following 3 factors:
- Efficacy: The resource (especially research papers) should show a significant improvement in the condition being treated. Resources that show better results are given a higher quality score.
- Detail: The source must give enough information that the results can be duplicated. If a resource lacks too many details that it cannot be recreated, it is given a lower detail score.
- Lack of Bias: Many resources are created to try and show that one device is superior to its competition. Many manufacturers have staff that crank out biased papers on a regular basis on the hope that this will make their product look superior. If the author of the resource is paid by a manufacturer of the resource appears to be biased towards one device and not one technology, the resource has much less value.
Over the past few years of working with research, we found that a majority of the published resources are lacking in one of these three ranking factors.
The original goal of this research tool was to tie published resources to the protocols in the laser-therapy.us library. This connection allows users to trace each protocol back to a list of resources so the protocol can be researched and improved.
General Comments
POWER
When many of the first research papers were published, the most power laser available for therapy were less than 100mW and many systems had to be pulsed to keep the laser from burning out too quickly. Today, system are available that will deliver up to 60,000mW of continuous output. Because of these power limitation, many early studies were limited to extremely low dosages by today’s standards. It takes a 50mW system 17 minutes to deliver 50 joules at the surface of the skin. If this was spread over a large area of damage or was treating a deeper problem, the actual dosages were much less than 1J/cm2. Today, we know that these dosages typically produce very little or no results.
WAVELENGTH
About 80% of the resources in this database are in the near infrared wavelength. There is also some interest in the red wavelength (600 to 660nm) . Other wavelengths like blue, purple, and green have very little scientific research behind them and have not gotten much traction in the core therapy market with the exception of some fringe consumer products.
Legal Disclaimer
This research tool is free to use but we make no claims about the accuracy of the information. It is an aggregation of existing published resources and it is up to the user to determine if the source of the resources has any value. The information provided through this web site should not be used for diagnosing or treating a health problem or disease. If you have or suspect you may have a health problem, you should consult your local health care provider.
Biophtonica Introduction
Biophotonica - (Website) 4523
View Resource
Welcome to the BioPhotonica Education Center. There are over 5000 successful studies showing the efficacy of PBM, light therapy and sound therapy. This is a searchable collection of technical publications, books, videos and other resources about the best practices in the industry and about treating a wide variety of problems. All the resources include links to the original source (where available) so we are not making any claims about the use of our technology for treating "non-FDA cleared" applications, we are simply summarizing what the expert are saying about proper application of these technologies.
Enter a keyword above and click on one of the following links to see a set of publications about that subject. HINT: Shorter keywords work better.
Here are some of our favorite queries:
- Whole Body Systems
- Treating Post Covid with PBMT
- Info for beginners (See several graphic representation of the PBM chemical process)
- Best wavelength for light therapy (980nm vs. 810nm vs 660nm...)
- Pulsing Versus continuous wave
- Dosage: Searching for the best practices for dosage
- Great summary of positive double blind studies
Testimonials
- Amazing results
- Video testimonials from patients
- Video testimonials from doctors
- Incredible results in animals
- Increasing athletic performance
Research Info for other Applications
- Stem cell production in laser therapy
- Cosmetic and skin therapy parameters
- Laser acupuncture
- Traumatic Brain Injury (TBI)
- Soft Tissue Injury
- Fertility and Reproductive Health
Autoimmune Research
Contraindications
This tool uses a broad match query so:
- It does not correct spelling and searches only PBM related subjects so do not use LLLT, cold or laser in the search bar
- It works better with shorter search terms or even parts of search terms
- It searches all the available fields so you can enter a body part, author, condition or laser brand.
- This system is only for photobiomodulation or cold laser therapy research (including LLLT, laser acupuncture and high power laser therapy) only. It does NOT include photodynamic laser therapy (where the laser is used to react with a pharmaceutical), hot surgery lasers or cosmetic therapies.
Light House Health Introduction
LightHouse - (Website) 4515
View Resource
Welcome to the Lighthouse Health Education Center. There are over 5000 successful studies showing the efficacy of PBM, light therapy and sound therapy. This is a searchable collection of technical publications, books, videos and other resources about the best practices in the industry and about treating a wide variety of problems. All the resources include links to the original source (where available) so we are not making any claims about the use of our technology for treating "non-FDA cleared" applications, we are simply summarizing what the expert are saying about proper application of these technologies.
Enter a keyword above and click on one of the following links to see a set of publications about that subject. HINT: Shorter keywords work better.
Here are some of our favorite queries:
- Whole Body Systems
- Treating Post Covid with PBMT
- Info for beginners (See several graphic representation of the PBM chemical process)
- Best wavelength for light therapy (980nm vs. 810nm vs 660nm...)
- Pulsing Versus continuous wave
- Dosage: Searching for the best practices for dosage
- Great summary of positive double blind studies
Testimonials
- Amazing results
- Video testimonials from patients
- Video testimonials from doctors
- Incredible results in animals
- Increasing athletic performance
Research Info for other Applications
- Stem cell production in laser therapy
- Cosmetic and skin therapy parameters
- Laser acupuncture
- Traumatic Brain Injury (TBI)
- Soft Tissue Injury
Autoimmune Research
Contraindications
This tool uses a broad match query so:
- It does not correct spelling and searches only cold laser related subjects so do not use LLLT, cold or laser in the search bar
- It works better with shorter search terms or even parts of search terms
- It searches all the available fields so you can enter a body part, author, condition or laser brand.
- This system is only for photobiomodulation or cold laser therapy research (including LLLT, laser acupuncture and high power laser therapy) only. It does NOT include photodynamic laser therapy (where the laser is used to react with a pharmaceutical), hot surgery lasers or cosmetic therapies.
The query result(s) can be shared using the following direct link. Anyone who clicks on this link in an email or on a web site will be shown the current results for the query.
https://www.laser-therapy.us/research/index.cfm?researchinput=video
Can near-infrared energy reach the brain for treatment of TBI? - Video abstract [78182]
Larry D. Morries, Theodore A. Henderson MD, PhD - 2015 (Video) 4323This research was done under the supervision of NASA and seems to be some of the most independent research comparing therapy laser parameters.
This video was created to support their published research. The authors did research using several lasers and slices of a sheep’s brain to try and determine the best parameter for treating TBI (Traumatic Brain Injury) with a desired fluency of 0.9 to 15 joules/cm2 at a depth of 2 cm. They state that getting the energy through the skull is especially difficult so they test multiple options so test the transfer rate. They started out using a continuous output split 980/810nm system (the only company that makes that type of split system, 80% of the power at 980nm and 20% of the power at 810nm, is LiteCure with their LightForce series). The result was less than 1/2% of the energy reached a depth of 2cm. Then they switched to pulsing and got an increase in the energy transfer. When they switched to a 810nm-only 15 watt system with pulsing the transfer rate increased to 16% of the output energy reached the target depth.
Here are some rough numbers to review the feasibility of using this system for treatment. If the duty cycle is 70%, the system will deliver 1.68 joules per second at a depth 2cm (15wattS*70%*16%). To get 5 joules/cm2 over 15 x 15 cm treatment area would require a total of 1125 joules at depth. This would take 23 minutes.
This research shows that only class 4 systems can delivery the level of power needed for this kind of therapy in a typical rushed doctor's office. A class 3b system with 1 watt would take 4 - 5 hours per treatment to get the same dosage.
The original research publication is titled " Treatments for traumatic brain injury with emphasis on transcranial near-infrared laser phototherapy"
video length: (9:18)
Original Source: https://www.youtube.com/watch?v=iZbP2IVekh0
Effect of autologous mesenchymal stem cells induced by low level laser therapy on cardiogenesis in the infarcted area following myocardial infarction in rats
Hana Tuby1, Tali Yaakobi1, Lidya Maltz1, Yaakov Delarea2, Orit Sagi-Assif2, Uri Oron1* - (Publication) 4467This study showed rats that were give a heart attack and then treated with the laser on their shins saw a 55% reduction in infarction size in the heart showing that the stem cells released from the bone migrated to the heart.
1Department of Zoology, The George S. Wise Faculty of Life Sciences, Tel-Aviv University, Tel-Aviv, Israel
2Department of Cell Biology and Immunology, The George S. Wise Faculty of Life Sciences, Tel-Aviv University, Tel-Aviv, Israel
Email: *oronu@post.tau.ac.il
Received 27 May 2013; revised 29 June 2013; accepted 16 July 2013
ABSTRACT
In this study, we investigated the hypothesis that photo- biostimulation by low-energy laser therapy (LLLT) applied to the bone marrow (BM) of myocardial in- farcted rats may attenuate the scarring processes that follow myocardial infarction (MI). Wistar rats under- went experimental MI. LLLT (Ga-Al-As diode laser) was applied to the BM of the exposed tibia at differ- ent time intervals post-MI (4 hrs, 48 hrs and 5 days). Sham-operated infarcted rats served as control. In- farct size was significantly reduced (55%) in the la- ser-treated rats as compared to the control non-treat- ed rats, at 2 weeks post-MI. A significant 3-fold in- crease was observed in the density of desmin immu- nopositive stained cells 14 days post-MI in the infarc- ted area of the laser-treated rats as compared to the non-laser-treated controls. The electron microscopy from the control infarcted rat hearts revealed a typi- cal interphase area between the intact myocardium and the infarcted area, with conspicuous fibroblasts with collagen deposition dispersed among them. In rats that were laser treated (to BM), the interphase zone demonstrated cells with different intracellular struc- tures. There was also a significant increase in the per- centage of c-kit positive cells and macrophages in the circulating blood of the laser treated rats as compar- ed to control non treated ones. In the majority of the cells clusters of myofibrils anchored to well-developed Z-lines and structures resembling the morphological characteristics of mature intact cardiomyocytes were evident. In conclusion, LLLT to the BM of rats post- MI induces cardiogenesis mainly at the borders of the infarcted area in the heart.
Keywords: Low-Level Laser Therapy; Myocardial Infarction; Macrophage; Desmin; Ultrastructure; c-Kit Positive Cells
1. INTRODUCTION
Regenerative capacity and mitotic activity in the heart are confined mainly to the lower vertebrates [1]. Amputation of ~20% of the zebrafish’s ventricular myocardium re- sulted in full regeneration without scarring [2]. In am- phibians, heart injury was associated with increased cell proliferation of myocytes and enhanced regeneration [3]. The adult mammalian heart was traditionally considered to be a post-mitotic organ with terminally differentiated cardiac myocytes. However, this dogma has recently been challenged by several studies and reviews [4-8]. These studies have suggested that cardiac myocytes are replaced throughout the lifespan even in the human heart, and that myocytes can regenerate from resident cardiac progenitor cells (CPC) as well as from bone marrow (BM). Studies in human infarcted hearts have shown evidence of cytoki- nesis of cells in the heart and evidence of cardiac stem cells that are activated in response to ischemic injury. This growth response is attenuated in chronic heart fail- ure [9]. Some studies have reported that cardiac myocyt- es can be derived from BM; specifically, side population precursor cells following induction of myocardial infarc- tion (MI) by left anterior descending artery (LAD) liga- tion [10-12]. Contradicting these findings, other laborato- ries using genetic markers have reported that lineage ne- gative, c-kit+ BM cells did not differentiate into cardio- myocytes [13]. It was also suggested that BM-derived stem cells may stimulate the small population of stem cells in the ischemic heart to proliferate and differentiate to enhance cardiac repair post-MI [14]. In a recent study transient regenerative potential in the mouse heart was demonstrated during the neonatal period [15].
Low-level laser therapy (LLLT) has been found to modulate various biological processes [16,17], such as increasing mitochondrial respiration and ATP synthesis [18], facilitating wound healing and promoting the proc- ess of skeletal muscle regeneration and angiogenesis [19- 21]. In an experimental model of the infarcted heart in rats and dogs, it was demonstrated that LLLT application directly to the infarcted area in the heart at optimal power parameters significantly reduced scar tissue formation [22-24]. This phenomenon was partially attributed to a significant elevation in ATP content, heat shock proteins, vascular endothelial growth factor (VEGF), inducible ni- tric oxide (NO) synthase, and angiogenesis in the ischemic zone of the laser-irradiated rats, as compared to non- irradiated rats [25].
The effect of photobiostimulation on stem cells or pro- genitor cells has not been extensively studied. LLLT ap- plication to normal human neural progenitor cells signi- ficantly increases ATP production in these cells [26]. LLLT delivery to MSCs and cardiac stem cells in vitro caused a significant enhancement in their proliferation rate [27,28]. LLLT has also been shown to increase the proliferation rate of adipose-derived stem cells in vitro [29]. Recently, we demonstrated that LLLT application to autologous BM could induce mesenchymal stem cells (MSCs) in the BM to proliferate and cause their recruit- ment and specific homing in on the infarcted rat heart and not on other organs [30,31]. The laser treatment to the BM also caused a marked and statistically significant reduction of 79% in the scarring and ventricular dilata- tion followed MI as compared to infarcted non-laser- treated rats. The aim of the present study was to investi- gate the possibility that induction of stem cells in the BM of rats by LLLT could also affect cardiogenesis in the in- farcted rat heart.
2. MATERIALS AND METHODS
2.1. Experimental Procedures
A total of 21 Wistar male rats, weighing 200 - 250 gr, that underwent ligation of the LAD artery to induce MI, were used as described by us previously [23]. All the ex- perimental procedures were approved by the animal care committee of Tel-Aviv University. Briefly, rats were anes- thetized with Avertin (1 ml/100 g body weight I.P.) and the lungs were ventilated. Thoractomy was performed by invasion of the intercostals muscles between the 5th and 6th rib to expose the heart. The LAD artery was occluded 2 mm from the origin with 5-0 polypropylene thread (Ethicon Inc., Cincinnati, OH). Following LAD artery occlusion the chest muscles and skin were sutured and the rats were ventilated until they woke up. The infarcted rats were divided randomly into two groups. In one group LLLT was applied directly to the BM 4 hrs, 48 hrs and 5 days post-MI (see below). The second group was non-laser-treated (the rat’s bone was exposed for the same duration as the laser-treated group but the laser was not turned on). Food and water were supplied ad libitum. Rats were sacrificed 14 days post-MI.
2.2. Laser Application
After induction of MI rats were randomly assigned to a laser-treated or control non-laser-treated group. A diode (Ga-Al-As) laser, wavelength 804 nm with a tunable po- wer output of maximum of 400 mW (Lasotronic Inc., Zug, Switzerland) for application to the BM was used. The laser device was equipped with a metal-backed glass fiber optic (1.5 mm diameter). An infrared viewer (Laso- tronic Inc. Zug, Switzerland) and infrared-sensitive de-tecting card (Newport, Inc., Irvine, CA) were used to de- termine the infrared irradiation area. Laser application was done by a 10 mm longitudinal cut in the skin above the medial aspect, and further delicate cleaning of the bone surface was carried out. The tip of the fiber optic (1.5 mm diameter) was placed perpendicularly to the center of the exposed medial aspect of the tibia and power den- sity of 10 mW/cm2 was applied to the BM. The laser was applied for a duration of 100 sec (energy density 1.0 J/cm2). Left or right exposed tibias were chosen at random for LLLT application. In sham-operated infarcted rats that served as control the tibias were exposed and the fi- ber optic was placed as described above but the laser beam was not turned on.
2.3. Histology and Electron Microscopy
A defined cross-section sample (2 mm thick) from the central part of the infarcted area was taken from all hearts for histology. Eight micron paraffin sections were pre- pared from the tissue samples of each heart. Infarct size was determined using Masson’s trichrome staining as described by us previously [23]. Three observers, blinded to control or laser-treated rats, analyzed infarct size. Six microscopic slides from the infarcted area of each heart were chosen at random for determination of infarct size. Infarct size was expressed as the percentage of the total infarcted area relative to the total area of the left ventri- cle (LV) in each section, using image analysis software Sigma Scan Pro (Sigma, St. Louis, MO).
For electron microscopy three tissue samples from each of the control and laser-irradiated rat hearts were taken from the interphase zone between the infarcted and non-infarcted tissue by macroscopic examination. Fixa- tion was performed in 3.5% glutaraldehyde in 0.1 M ca- codylate buffer for 24 hrs followed by embedment in Epon-812. Semi-thin sections (1 micron) were prepared in order to localize the interphase zone. Thin sections were then prepared and stained with uranyl acetate and lead citrate followed by examination with a Jeol electron microscope.
2.4. Immunohistochemistry
The total number of cells immunostained for desmin (bone marrow cells or newly formed) in the infarcted area were determined using a desmin kit (Zytomed Laboratory, Ber- lin, Germany). The procedure was performed at room temperature with anti-mouse (dilution 1:25 - 1:50) primary antibody for 60 min. Following washing, slides were in- cubated with HRP secondary antibody for mouse for 30 min followed by DAB Chromogen system (Covance Inc., Dedham). Slides were rinsed again in wash buffer, stain- ed in Hematoxylin for nuclei detection, mounted and viewed using a Zeiss microscope equipped with a camera and video screen. The total number of desmin immuno- stained cells within the infarcted area was counted and their density expressed as the percentage of the total area of the infarct using SigmaPro software.
2.5. Flow Cytometry Analysis
Blood samples were taken 2 and 7 days post-IR injury for fluorescence-activated cell sorting (FACS) analysis. 100 μl of blood were mixed with different antibodies: anti-mouse CD117 (c-kit) PE (eBioscience San Diego, USA) and rat IgG2b isotype control PE (eBioscience San Diego, USA) and anti-rat macrophage marker PE (eBio- science San Diego, USA) and mouse IgG2a K isotype control PE (eBioscience San Diego, USA), were used for the FACS analysis according to the manufacturer’s guide- lines. Forty five min post incubation of the whole fresh blood with the relevant antibodies, 2 ml of Fix/Lyse so- lution (eBioscience, San Diego, USA) was added. After mixture the suspended cells were left for 60 min in the dark at room temperature. Centrifugation was performed for 10 min, supernatant was removed and washing of the pellet was performed with 2 ml of Flow Cytometry Stain- ing Buffer Solution (eBioscience, San Diego, California, USA). After another centrifugation for 10 minutes the supernatant was decanted. The pellet containing mono- nucleated cells was resuspended in 200 μl of flow stain buffer for FACS analysis.
2.6. Statistical Analysis
The SigmaStat 2.0 (Sigma, St. Luis, USA) software was used for statistical analysis. Tests were performed first for normality distribution, followed by parametric (stu- dent’s t-test) test.
3. RESULTS
Application of LLLT to the infarcted heart caused a sig- nificant (p = 0.049) reduction of 55% in infarct size as compared to control. The present of macrophages and c- kit positive cells in the blood was determined by FACS analysis (Figure 1). It was found that at 5 days post MI there was a statistical significant 2-fold higher concentra- tion of macrophages and significant 1.4-fold higher c-kit positive cells (mesenchymal cells) in the laser treated rats as compared to the infarcted non laser treated rats. Des- min immunostaining of histological sections of the in- farcted zone from laser-treated rats demonstrated a higher density of positively stained cells than in the non laser-treated ones (Figures 2-4). In the interphase zone, cells extending from the myocardium towards the in
Figure 1. Percent (out of total mononucleated cells) of macro- phages and c-kit positive cells in blood of control and laser treated rats (to the bone marrow) 5 days post MI as revealed by FACS analysis. The results are mean ± S.E.M of 15 rats at each group. Statistical significance *p < 0.05; **p < 0.01.
Figure 2. Representative desmin immunostained light micro- graphs of the infarcted zone of non-laser-treated rats (a, c) and laser-treated rats (to the bone marrow at 4 and 48 hrs and 5 days) (b, d) taken 2 weeks post-MI. Note that the zone in the control non-laser-treated rats contains mainly collageneous mate- rial with a few desmin immunopositive cells in the infarcted area (a, c); while in the laser-treated rats the zone displays posi- tive desmin staining in extended outgrowths (arrow) from the myocardium (MC) in (b), and in the cytoplasm of many cells in the infarcted area in (d). IF, Infarcted area. Bar = 50 μm.
farcted area showed higher immunostaining for desmin in the laser-treated rat hearts as compared to the control non-treated ones (Figure 2). The cell density of desmin immune-positive cells was also determined quantitatively in histological sections of both the infarcted laser-treated rats and infarcted non-laser-treated rats. The cell density was significantly (p < 0.01) 3-fold higher in the infarcted area of the laser-treated rats as compared to the non-la- ser-treated controls (Figure 4).
The electron micrographs of all samples taken from the control non-laser-treated infarcted rat hearts revealed a typical interphase area between intact and infarcted heart (Figure 5(a)). Adjacent to the non-ischemic intact myocardium there were conspicuous fibroblasts with col- lagen deposition dispersed among them (Figure 5(a)). In all samples taken from the laser-irradiated hearts the in- terphase zone between intact and infarcted area demon- strated different characteristics to those of the non-laser- treated infarcted rat hearts. Cells with newly-formed or- ganized contractile myofilaments dispersed in the cyto- plasm were detected in groups of several cells (Figure 5(b)). In these cells numerous mitochondria, clusters of ribosomes, and conspicuous clusters of contractile pro- teins were evident in the cytoplasm (Figures 6-8). Some cells contained dispersed contractile myofilaments in the cytoplasm that were still in an early stage of organization (Figure 6). The organization of newly-formed contractile myofilaments in the cytoplasm was observed in various
Figure 3. Representative desmin immunostained light micro- graphs of the interphase of the infarcted zone of laser-treated rats. Note that desmin positively stained cross-sections of myo- fibers (arrows) intermingled in the infarcted zone in (a). In (b) immunopositively stained cross-sections of myofibers (arrow) are visible in the infarcted area (IF). In (c) newly-formed car- diomyocytes (NC) are seen, with the desmin immunostaining mainly confined to the Z-line. Bar = 50 μm.
Figure 4. Density of desmin positively stained area (relative to total area) in the infarcted areas of control (non-laser-treated) and laser-treated (to the bone marrow) rats at 14 days post-MI. Results are mean+ S.E.M from 6 - 8 rats in each group. **p < 0.01.
Figure 5. Electron micrographs of typical interphase zone be- tween myocardium and infarcted area of control non-laser- treated (a) and laser-treated (b) to bone marrow rats. Note intact myocardium (MY) and adjacent fibroblast (FB) in the infarcted area surrounded by collagen (CL) deposition in (a). In (b) sev- eral newly-formed cardiomyocytes (marked with asterix) with conspicuous well-organized myofilaments (MF) in their cyto- plasm are evident adjacent to blood capillaries (CA). EN, En- dothelial cell.
degrees of maturation in those cells. In some cells the myofilaments were dispersed in the cytoplasm and in others they were organized in clusters anchored to well- developed Z-lines (Figure 7(a)). In certain cells the myo- filaments were organized parallel to the longitudinal di- rection of the cells, resembling the morphological char- acteristics of mature intact cardiomyocytes (Figure 7(b)). Some of the cells were also seen in a process of forma- tion of typical intercalated disc between them (Figure 9).
4. DISCUSSION AND CONCLUSION
The most significant outcome of this study was the ap- pearance of newly-formed cardiomyocytes following laser treatment to the BM, as indicated by light and electron microscopy. There was a 3-fold increase in the density of
Figure 6. Electron micrographs of most probably newly-formed cardiomyocytes at an early stage of organization of contractile myofilaments. Note myofilaments (MF) in the cytoplasm. M, Mitochondrion. Bar = 1 μm.
Figure 7. Electron micrographs of most probably newly-formed cardiomyocytes with early (a) and late (b) stages of the organi- zation of the contractile myofilaments in the cytoplasm. Note contractile myofilaments that are dispersed (DMF) in the cyto- plasm with a few organized in clusters anchored to Z-lines (Z) in (a). In (b) myofilaments (MF) are organized in parallel to the longitudinal axis of the cardiomyocyte, resembling their orga- nization in mature cardiomyocyte. N, Nucleus. Bar = 1 μm.
desmin immunostained cells in the infarcted rat hearts that had been laser treated. Desmin is a protein found in the cytoplasm of developing myocytes and cardiomyo- cytes [32]. The significantly higher occurrence of des- min-positive cells in the infarcted area of the laser- treated hearts may indicate the synthesis of new contrac- tile proteins in the developing new cardiomyocytes, re- sembling the process that takes place during embryonic development. The ultrastructural features of the cells in the interphase between the intact myocardium and the
Figure 8. Electron micrographs of typical interphase zone be- tween myocardium and infarcted area of laser-treated infarcted rat heart. Note numerous mitochondria (M) in the cytoplasm of the cardiomyocytes in (a) and (b). Also note organized contrac- tile myofilament with well-developed Z-lines (Z), some dis- persed myofilaments and clusters of ribosomes (R). Bar = 1 μm.
Figure 9. Electron micrographs of typical intercalated disk formation in the interphase region of the infarcted heart of la- ser-treated rats. Formation of intercalated disks (ID) between cells (marked with asterix) is evident. Note that the most proba- bly newly-formed cardiomyocytes contain clusters of myofila- ments (MF) in the cytoplasm that are conspicuous in their obli- que or cross-sections (arrows). Bar = 1 μm.
infarcted myocardium of the laser-treated rats, as shown in this study, clearly resemble the characteristics of car- diomyocytes during embryonic development of the heart [33]. Furthermore, the clusters of ribosomes and the nu- merous clusters of mitochondria in the cytoplasm of these cells may characterize cells that are active in the synthe- sis of proteins. It was previously demonstrated that direct LLLT to the infarcted hearts of rats, dogs and pigs caus- ed a significant reduction of scarring post-MI [23,24]. It was suggested that part of this reduction could be ex- plained by the regenerative response that takes place in the interphase zone [24].
The results of the present study indicate that the LLLT
applied to autologous BM attenuates the concentration of macrophages and MSC in the circulating blood. We have previously shown that LLLT application to the BM of infarcted rats caused a 2 fold enhancement in the rate of proliferation of MSC in the BM [30]. Those cells that most probably leave the BM to the circulating blood in- deed show a significant elevation of their concentration (as reveled by the FACS analysis in the present paper) at 5 days post MI. Consequently these cells probably home in on the infarcted heart, and even migrate specifically to the infarcted area [30]. These cells may induce cardiac stem cells to differentiate to newly-formed cardiomyo- cytes, as suggested previously by Hatzistergos et al. [14]. Indeed, it was found that endogenous c-kit+ cardiac stem cells were increased by 20-fold in the rat infarcted heart compared to control, following transcardial injection of BM-derived MSCs [14]. Such induction may be enabled due to paracrine secretion of various growth factors by the laser-stimulated MSC that originated from the BM. The possibility that paracrine secretion occurs in im- planted stem cells during cell therapy to the heart post- MI has been suggested previously [34]. Another mecha- nism that may take place after homing of stem cells to the infarcted heart of the laser-stimulated rats is that these cells continue to proliferate in the appropriate mi-lieu of the interphase zone in the infarcted heart and then differentiate to cardiomyocytes [30].
Another possible mechanism that maybe associates with the reduction of infarct size is the significant increase in the concentration of macrophages in the circulation fol- lowing LLLT to the BM as revealed from the FACS analysis in the present study. These findings corroborate with studies indicating that macrophages activity in the infarcted area at early stages post MI cause reduction of scarring post MI [35,36]. Thus, it could be postulated that more macrophages that will eventually home in the infarcted area from the circulating blood in the laser treated rats will also contribute to the reduction of scar- ring.
Although the findings of the present study do not in- dicate the extent of regenerative capacity of the rat in- farcted heart post-laser-irradiation, they do reveal a shift from practically no cardiomyocytes in the tissue samples taken from the non-laser-treated hearts, to the presence of newly-formed cardiomyocytes in all the electron mi- croscope sections taken from the hearts of rats that are laser-treated to the BM.
In conclusion, to the best of our knowledge, this is the first study to demonstrate the appearance of newly-form- ed cardiomyocytes in the infarcted area following LLLT to autologous BM in the infarcted rat heart. The mecha- nisms associated with this phenomenon remain to be elu- cidated in further studies.
5. ACKNOWLEDGEMENTS
This study was partially supported by the Elizabeth and Nicholas Shle- zak Super-center for Cardiac Research and Medical Engineering. The authors wish to acknowledge N. Paz for editing the manuscript and V. Wexler for helping with preparation of the figures.
REFERENCES
[1]
Rumyantsev, P.P. (1977) Interrelations of the prolifera- tion and differentiation processes during cardiac myoge- nesis and regeneration. International Review of Cytology, 51, 186-273. doi:10.1016/S0074-7696(08)60228-4
[2]
Poss, K.D., Wilson, L.G. and Keating, M.T. (2002) Heart regeneration in zebrafish. Science, 298, 2188-2190. doi:10.1126/science.1077857
[3]
Rumyantsev, P.P. (1973) Post-injury DNA synthesis, mi- tosis and ultrastructural reorganization of adult frog car- diac myocytes. An electron microscopic-autoradiographic study. Z Zellforsch Mikrosk Anat, 139, 431-50. doi:10.1007/BF00306596
[4]
Barnett, P. and van den Hoff, M.J.B. (2011) Cardiac re- generation: Different cells same goal. Medical & Biologi- cal Engineering & Computing, 49, 723-732. doi:10.1007/s11517-011-0776-5
[5]
Bollini, S., Smart. N. and Riley, P.R. (2011) Resident car- diac progenitor cells: At the heart of regeneration. Jour- nal of Molecular and Cellular Cardiology, 50, 296-303. doi:10.1016/j.yjmcc.2010.07.006
[6]
Choi, W.Y. and Poss, K.D. (2012) Cardiac regeneration. Current Topics in Developmental Biology, 100, 319-343. doi:10.1016/B978-0-12-387786-4.00010-5
[7]
Laflamme, M.A. and Murry, C.E. (2011) Heart regenera- tion. Nature, 473, 326-335. doi:10.1038/nature10147
[8]
Steinhauser, M.L. and Lee, R.T. (2011) Regeneration of the heart. EMBO Molecular Medicine, 3, 701-712. doi:10.1002/emmm.201100175
[9]
Urbanek, K., Torella, D., Sheikh, F., De Angelis, A., Nur- zynska, D., Silvestri, F., Beltrami, C.A., Bussani, R., Bel- trami, A.P., Quaini, F., Bolli, R., Leri, A., Kajstura. J. and Anversa, P. (2005) Myocardial regeneration by activation of multipotent cardiac stem cells in ischemic heart failure. Proceedings of the National Academy of Sciences of the USA, 102, 8692-8697. doi:10.1073/pnas.0500169102
[10]
Bittner, R.E., Schofer, C., Weipoltshammer, K., Ivanova, S., Streubel, B., Hauser, E., Freilinger, M., Höger, H., Elbe- Bürger, A. and Wachtler, F. (1999) Recruitment of bone- marrow-derived cells by skeletal and cardiac muscle in adult dystrophic mdx mice. Anatomy and Embryology, 199, 391-396. doi:10.1007/s004290050237
[11]
Jackson, K.A., Majka, S.M., Wand, H., Pocius, J., Hart- ley, C.J., Majesky, M.W., Entman, M.L., Michael, L.H., Hirschi, K.K. and Goodell, M.A. (2001) Regeneration of ischemic cardiac muscle and vascular endothelium by adult stem cells. The Journal of Clinical Investigation, 107, 1395-1402. doi:10.1172/JCI12150
[12]
Pfister, O., Mouquet, F., Jain, M., Summer, R., Helmes, M., Fine, A., Colucci, W.S. and Liao, R. (2005) CD3- but not CD31+ cardiac side population cells exhibit functio- nal cardiomyogenic differentiation. Circulation Research, 97, 52-61. doi:10.1161/01.RES.0000173297.53793.fa
[13]
Balsam, L.B., Wagers, A.J., Christensen, J.L., Kofidis, T., Weissman, I.L. and Robbins, R.C. (2004) Haematopoietic stem cells adopt mature haematopoietic fates in ischaemic myocardium. Nature, 428, 668-673. doi:10.1038/nature02460
[14]
Hatzistergos, K.E., Quevedo, H., Oskouei. B.N., Hu, Q., Feigenbaum, G.S., Margitich, I.S., Mazhari, R., Boyle, A.J., Zambrano, J.P., Rodriguez, J.E., Dulce, R., Pattany, P.M., Valdes, D., Revilla, C., Heldman, A.W., McNiece, I. and Hare, J.M. (2010) Bone marrow mesenchymal stem cells stimulate cardiac stem cell proliferation and differ- entiation. Circulation Research, 107, 913-922. doi:10.1161/CIRCRESAHA.110.222703
[15]
Porrello, E.R., Mahmoud, A.I., Simpson, E., Hill, J.A., Richardson, J.A., Olson, E.N. and Sadek, H.A. (2011) Transient regenerative potential of the neonatal mouse heart. Science, 331, 1078-1080. doi:10.1126/science.1200708
[16]
Conlan, M.J., Rapley, J.W. and Cobb, C.M. (1996) Bio- stimulation of wound healing by low energy laser irradia- tion. Journal of Clinical Periodontology, 23, 492-496. doi:10.1111/j.1600-051X.1996.tb00580.x
[17]
Karu, T. (2007) Ten lectures on basic science of laser photherapy. Prima Books, Gragesberg.
[18]
Karu, T. (2010) Mitochondrial mechanisms of photobio- modulation in context of new data about multiple roles of ATP. Photomedicine and Laser Surgery, 28, 159-160. doi:10.1089/pho.2010.2789
[19]
Bibikova, A. and Oron, U. (1993) Promotion of muscle regeneration in the toad (Bufo viridis) gastrocnemius mu- scle by low energy laser irradiation. Anatomical Record, 235, 374-380. doi:10.1002/ar.1092350306
[20]
Bibikova, A., Belkin, A. and Oron, U. (1994) Enhancement of angiogenesis in regenerating gastrocnemius muscle of the toad (Bufo viridis) by low energy laser irradiation. Anatomy and Embryology, 190, 597-602. doi:10.1007/BF00190110
[21]
Oron, U. (2006) Photoengineering of tissue repair in ske- letal and cardiac muscles. Photomedicine and Laser Sur- gery, 24, 111-120. doi:10.1089/pho.2006.24.111
[22]
Yaakobi, T., Shoshani, Y., Levkovitz, S., Rubin, O., Ben- Haim, S.A. and Oron, U. (2001) Long term effect of low energy laser irradiation on infarction and reperfusion in- jury in the rat heart. Journal of Applied Physiology, 90, 2411-2441.
[23]
Oron, U., Yaakobi, T., Oron, A., Hayam, G., Gepstein, L., Wolf, T., Rubin, O. and Ben Haim, S.A. (2001a) Attenu- ation of the formation of scar tissue in rats and dogs post myocardial infarction by low energy laser irradiation. La- sers in Surgery and Medicine, 28, 204-211. doi:10.1002/lsm.1039
[24]
Oron, U., Yaakobi, T., Oron, A., Mordechovitz, D., Shof- ti, R., Hayam, G., Dror, U., Gepstein, L., Wolf, T., Hau- denschild, C. and Ben Haim, S.A. (2001b) Low energy la- ser irradiation reduces formation of scar tissue following myocardial infarction in dogs. Circulation, 103, 296-301.doi:10.1161/01.CIR.103.2.296
[25]
Tuby, H., Maltz, L. and Oron, U. (2006) Modulations of VEGF and iNOS in the rat heart by low energy laser irra- diation are associated with cardioprotection and enhanced angiogenesis. Lasers in Surgery and Medicine, 38, 682- 688. doi:10.1002/lsm.20377
[26]
Oron, U., Ilic, S., De Taboada, L. and Streeter, J. (2007) Ga-As (808 nm) laser irradiation enhance ATP produc- tion in human neuronal cells in culture. Photomedicine and Laser Surgery, 25, 180-182. doi:10.1089/pho.2007.2064
[27]
Tuby, H., Maltz, L. and Oron, U. (2007) Low-level laser irradiation (LLLI) promotes proliferation of mesenchy- mal and cardiac stem cells in culture. Lasers in Surgery and Medicine, 39, 373-378. doi:10.1002/lsm.20492
[28]
Li, W.T., Leu, Y.C. and Wu, J.L. (2010) Red-light light- emitting diode irradiation increases the proliferation and osteogenic differentiation of rat bone marrow mesenchy- mal stem cells. Photomedicine and Laser Surgery, 28, S-157-S-165. doi:10.1089/pho.2009.2540
[29]
Mvula, B., Moore, T.J. and Abrahamse, H. (2010) Effect of low-level laser irradiation and epidermal growth factor on adult human adipose-derived stem cells. Lasers in Medical Science, 25, 33-39. doi:10.1007/s10103-008-0636-1
[30]
Tuby, H., Maltz, L. and Oron, U. (2011) Induction of au- tologous mesenchymal stem cells in the bone marrow by low-level laser therapy has profound beneficial effects on the infarcted rat heart. Lasers in Surgery and Medicine, 43, 401-409. doi:10.1002/lsm.21063
[31]
Oron, U. (2011) Light therapy and stem cells: A thera- peutic intervention of the future. Journal of Interventio- nal Cardiology, 3, 627-629.
[32]
Toma, C., Pittenger, M.F., Cahill, K.S., Byrne, B.J. and Kessler, P.D. (2002) Human mesenchymal stem cells dif- ferentiate to a cardiomyocyte phenotype in the adult mu- rine heart. Circulation, 105, 93-98. doi:10.1161/hc0102.101442
[33]
Oron, U. and Mandelberg, M. (1985) Focal regeneration in the rat myocardium following cold injury. Cell Tissue Research, 241, 459-463. doi:10.1007/BF00217194
[34]
Mummery, C.L., Davis, R.P. and Krieger, J.E. (2010) Challenges in using stem cells for cardiac repair. Science Translational Medicine, 14, 1-5.
[35]
van Amerongen, M.J., Harmsen, M.C., van Rooijen, N., Petersen, A.H. and van Luyn, M.J. (2007) Macrophage dep- letion impairs wound healing and increases left ventricu- lar remodeling after myocardial injury in mice. American Journal of Pathology, 170, 1093-1103. doi:10.2353/ajpath.2007.060547
[36]
Okazaki, T., Ebihara, S., Asada, M., Yamanda, S., Saijo, Y., Shiraishi, Y., Ebihara, T., Niu, K., Mei, H., Arai, H. and Yambe, T. (2007) Macrophage colony-stimulating factor improves cardiac function after ischemic injury by induc- ing vascular endothelial growth factor production and sur- vival of cardiomyocytes. American Journal of Pathology, 171, 1093-1103. doi:10.2353/ajpath.2007.061191
Original Source: http://www.scirp.org/journal/jbise
LLLT for Traumatic Brain Injury (TBI)
Michael Hamblin - 2013 (Video) 4322Dr Hamblin is associated with Harvard and the Wellman center. He is a distinguished author and spokeman for all type of medical lasers but he is also associated with Thor.
Dr. Hamblin discusses the use of low level laser therapy for all type of brain injuries. He is an expert in all type of light healing (see below). He has performed much of his research on rats. He claims several key points:
- 10 Hertz is the preferred pulsing frequency for the brain
- 810nm is the preferred wavelength for cell interaction.
- The best treatment period is about 7 sessions but less than 14 days of treatments. Going to longer term treatments seems to reduce the effectiveness.
This video is mainly about TBI but the principals are universal. Dr Hamblin is associated with Thor laser so there is some potential for bias but he is also assocated with Harvard and the Wellman Centre. Introduction to Low Level Laser Therapy (LLLT) for Traumatic Brain Injury (TBI) by Mike Hamblin. Wellman Centre for Photomedicine, Harvard Medical School.
video length: (6:18)
This video is restricted for minors.
Original Source: https://www.youtube.com/watch?v=sl5T1Lw0B5o
Dr Michael Hamblin: Harvard Professor and Infrared Therapy Expert
Dr. Michael Hamblin - 2015 (Video) 4336Dr. Hamblin is a Harvard professor and has been studying the effects of LLLT for many years, but he is also associated with Thor.
In this video Dr. Michael Hamblin is interviewed by youtuber Selfhacked. Dr. Hamblin discusses the use of red and near infrared light in low level light therapy, he talks about the different possibilities of LLLT as well as some of his personal experiences with LLLT. He explains the reasons behind some of the effects from LLLT noticed in patients over the years, including it's effect on calcium in cells, ion channels, and infrared light vs. ultraviolet light. Dr. Hamblin also notes the differences between LLLT, bright light therapy, and light from the sun that is used for theraputic purposes. The majority of the video is spent discussing the effect of LLLT on the brain specifically.
video length: (52:08)
Original Source: http://selfhacked.com/2015/07/18/interview-with-dr-michael-hamblin-harvard-professor-and-infrared-therapy-expert/
Dr. Juanita Anders Intro to PBM
Dr. Juanita Anders - (Video) 4516This video is about a 1 hour video but it covers alot of details about PBM.
This video features Dr. Juanita Anders who is a pioneer and expert in the field of PBM. This is a great overview of the science and concepts in PBM. While the talk does get pretty technical and involved in places, a full understanding of all of the biological mechanisms that Dr. Anders discusses isn't necessary to get a high level understanding of the science and benefits of light therapy.
Original Source: https://www.youtube.com/watch?v=0MMewRIP51M
The Science On Red Light Therapy Benefits w/ Dr. Michael Hamblin, Ph.D. and Ari Whitten
Dr. Michael Hamblin - Youtube (Video) 4517This is a 1 and 1/2 hour interview with Dr Hamblin covers alot of details on PBM.
This link is an audio interview with Dr. Michael Hamblin (an associate professor at Harvard Medical School) and is an informative podcast type of interview regarding the latest in PBM research.
Original Source: https://www.youtube.com/watch?v=D9oUlKpo1ek&t=6s
Near-infrared light increases ATP, extends lifespan and improves mobility in aged Drosophila melanogaster
Rana Begum 1 , Karin Calaza 2 , Jaimie Hoh Kam 1 , Thomas E. Salt 1 , Chris Hogg 3 and Glen Jeffery - Royal Society Publishing (Publication) 4509PBM increased the average lifespan and mobility of fruit flies. Although they all died at 12 weeks, treating the flies with PBM significantly increase the average healthspan.
Near-infrared light increases ATP, extends lifespan and improves mobility in aged Drosophila melanogaster Rana Begum 1 , Karin Calaza 2 , Jaimie Hoh Kam 1 , Thomas E. Salt 1 , Chris Hogg 3 and Glen Jeffery Institute of Ophthalmology, University College London, London EC1V 9EL, UK 2 Program of Neuroscience, Institute de Biologia, Universidade Federal Fluminense, Rio de Janeiro 24210130, Brazil 3 Moorfields Eye Hospital, London EC1V 2PD, UK Ageing is an irreversible cellular decline partly driven by failing mitochondrial integrity. Mitochondria accumulate DNA mutations and reduce ATP production necessary for cellular metabolism. This is associated with inflammation. Near-infrared exposure increases retinal ATP in old mice via cytochrome c oxidase absorption and reduces inflammation. Here, we expose fruitflies daily to 670 nm radiation, revealing elevated ATP and reduced inflam- mation with age. Critically, there was a significant increase in average lifespan: 100–175% more flies survived into old age following 670 nm exposure and these had significantly improved mobility. This may be a simple route to extending lifespan and improving function in old age. 1. Introduction Mitochondria provide cellular energy via adenosine triphosphate (ATP). But, their DNA (mtDNA) suffers from progressive mutations resulting in reduced ATP production, which is thought to run concomitantly with an increase in pro-inflammatory reactive oxygen species (ROS) [1,2]. Hence, hallmarks of ageing are reduced cellular energy and progressive systemic inflammation. Meta- bolic demand also plays a role as tissues and organisms with high metabolic rates generally suffer from rapid ageing [3,4]. The retina has the greatest metabolic demand in the body [5], but ATP decline in the central nervous system can be significantly improved by near-infrared/infrared light (NIR/IR, [6]). Specific wavelengths in this range are absorbed by cytochrome c oxidase in mitochondrial respiration, improving its efficiency [7–10]. These wavelengths improve mito- chondrial membrane potentials, significantly reduce inflammation and reduce macrophage numbers with brief exposures of around 60–90 s repeated over approximately a week [11,12]. NIR/IR also reduces experimental pathology when insult impacts on mitochondrial function, as in experimental Parkinson’s disease, where NIR significantly reduces cell death in the substantia nigra [13]. However, NIR/IR studies have largely used light for short periods and their impact on lifespan has not been assessed [7,11,12]. If NIR improves mitochondrial function we predict it may extend life. The fly has been used here because of its relatively short life [14]. Hence, we ask if long-term exposure to 670 nm in Drosophila melanogaster can increase lifespan and improve function in old age. 2. Material and methods Drosophila melanogaster were used. Hatched male flies were housed on 12/12 light cycle at 258C within a season. Half were exposed to 670 nm for 20 min per day at & 2015 The Authors. Published by the Royal Society under the terms of the Creative Commons Attribution License http://creativecommons.org/licenses/by/4.0/, which permits unrestricted use, provided the original author and source are credited. on March 18, 2015http://rsbl.royalsocietypublishing.org/Downloaded from 40 mW cm 22 in clear plastic 50 cm 3 (28 mm wide) containers, illuminating flies from either side, which were counted weekly. Room illumination was 2 mW cm 22 . 670 nm energies were approximately 100 times lower than indirect sunlight, consistent with earlier studies [7]. Light devices were built by C. H. Elec- tronics UK and contained 50 670 nm LEDS over 20 cm 2 . Six independent replicates were used in lifespan experiments (n ¼ 620 flies). ATP, inflammation and mobility were assessed at seven weeks, when ATP and mobility are known to decline [15]. ATP was measured by luciferin–luciferase assay (Enliten w ATP Assay System, Promega). Flies were killed with liquid nitrogen, transferred to 2.5% trichoroacetic acid (TCA), then homogenized at 48C. Supernatant was collected and the TCA was neutralized with 1 M Tris–acetate buffer (pH 7.75, final TCA concentration 0.0625%); 10 ml of neutralized solution was added to 100 ml of luci- ferin–luciferase in fresh buffer. ATP was measured using an Orion microplate luminometer (Berthold Detection Systems GmbH) and data normalized to fly numbers. Tissues were homogenized in 2% sodium dodecyl sulfate (SDS) with protease inhibitor cocktail for Western blot (Roche Diagnos- tics), and centrifuged; the supernatant was pipetted out, separated with 10% SDS–PAGE and electrophoretically transferred onto nylon membranes. Immunoblotting was undertaken for complement component C3 (Cappel, MP Biomedicals), which is highly conserved [16]. Protein was quantified by densitometric X-ray scanning and values were normalized to a-tubulin. Fly mobility assessment was as Bjedov et al. [14]. Flies were placed in 100 ml clear cylinders (seven flies per trial), tapped to the bottom and then videoed, the last two steps repeated three times. Using the videos, the number of flies above the 50 ml mark (9 cm from the bottom) was counted after 1 min. Individual flies were traced, with absolute distance travelled measured. Data w er e analysed with GraphPad P RISM v. 5 and sta t is ti cal analysis was undertaken using Mann –Whitne y U non-parametric and log-rank tests. 3. Results (a) ATP levels are elevated and systemic inflammation reduced Whole body ATP declines with age only after appr o xima tely seven weeks [14], when ATP was measured here. A TP concen- trations wer e significantly grea t er, by approxima tely 80%, in 670 nm exposed animals compared with unexposed (figure 1a, Mann–Whitney test p ¼ 0.028). At seven weeks, W estern blots wer e undertaken for inflammatory marker complement com- ponent C3. This was reduced in 670 nm exposed flies compared with controls (figure 1b). Hence, 670 nm radiation elevates ATP and reduces inflammation. (b) Lifespan increases Fly numbers in experimental and control groups were similar in the two weeks post-hatching. From week 3, fly deaths were greater in controls than 670 nm exposed flies and they remained so at each time point until week 11–12, when all flies were dead in both groups. This difference was significant (figure 2, log-rank test p ¼ 0.008). The progressive mean percentage increase in 670 nm flies alive over controls is given in figure 2b. Group differences accelerated from week 4, when 10% extra 670 nm treated flies were alive compared with controls, to approximately 50% extra when the control population had halved. By the time the control population was reduced by 80%, at week 8, more than 100% extra 670 nm treated flies remained alive. Subsequently, group differences reached almost 180% before declining to zero in both groups at week 11–12. Hence, 670 nm did not extend absolute lifespan. (c) Aged mobility increases Mobility of 670 nm treated and control flies was measured at seven weeks. Significantly more 670 nm treated flies climbed above the 50 ml level (9 cm) and significantly more travelled a greater distance than controls (Mann–Whitney test p ¼ 0.028, p ¼ 0.014, respectively). Twice as many 670 nm flies climbed above 50 ml (9 cm) compared with controls and these travelled twice the distance in 1 min compared with controls (figure 2c,d). Hence, 670 nm exposure significantly improves both lifespan and mobility. 4. Discussion Drosophila melanogaster has been widely used in lifespan studies as they are short lived and their genomic sequence is relatively well understood [14,17], hence their adoption experimentally here to extend lifespan. Our results reveal [ATP] (nM)/fly ATP level(a) C3 expression (Western blot)(b) control absolute intensity 670 control 670 control C3 ~ 110 kDa a-tubulin 55 kDa 670 * 0 0 500 1000 200 400 600 Figure 1. Exposur e to 670 nm radiation increases ATP in aged flies and reduces inflammati on. (a) Sev en week old flies exposed to 670 nm had a significant incr ease in whole body ATP compared with controls, p ¼ 0.028. n ¼ 25 flies per group. (b) Whole body inflammation (C3) was measured in seven week flies using W estern blot. This was reduced in 670 nm exposed flies by approxima tely 15%. Here, flies were pooled within groups as C3 protein levels were lo w in individuals. Hence there are no error bars. n ¼ 15 flies per group. (Online version in colour.) rsbl.royalsocietypublishing.org Biol. Lett. 11: 20150073 2 on March 18, 2015http://rsbl.royalsocietypublishing.org/Downloaded from that when flies are exposed to 670 nm radiation they have reduced inflammation, improved ATP, improved mobility and extended average lifespans. These data are consistent with the majority of studies undertaken using 670 nm on mammals, showing reduced inflammation in experimental models and in ageing, and improved ATP levels [6,7]. How- ever, it would be difficult to undertake lifespan experiments in mice as the light would not penetrate the entire body as it does in flies and hence its influence would not be systemic. There are many factors and pathways in ageing, and nine candidate hallmarks have been suggested, which may be separate, but also are likely to have interactions [1]. Mito- chondrial function is one. Previously, mitochondrial function and ageing were viewed within a framework of pro- gressive mtDNA mutations/deletions resulting in reduced ATP and increased ROS. The balance of these factors was seen as a driver in the mitochondrial theory of ageing [18]. However, evidence has undermined the role of ROS in ageing [19,20]. Hence, some mutant mice have reduced life- span as a result of mtDNA mutations/deletions not associated with increased ROS [21,22]. Further, increased ROS can prolong lifespan in yeast and Caenorhabditis elegans [22,23], and in mammals it does not accelerate ageing [20]. These data are reviewed by Lopez-Otin et al. [1], who argue that low ROS may activate compensatory mechanisms and not directly contribute to ageing. Such data may undermine the ROS element in Harman’s mitochondrial theory [18]. If correct, it places greater potential emphasis on ATP in ageing. NIR has been successful in treating induced pathology [7] and ageing, particularly in the retina, where progressive age- related inflammation is marked owing to high metabolic rate [11,12]. These wavelengths penetrate deeply and 670 nm trans-illuminated our flies at 40 mW cm 22 . In relation to this, it may be significant that, while old domestic incandescent light- ing contained significant NIR elements, none is present in modern strip lighting or energy-saving domestic lighting [12]. The absence of these wavelengths from artificial lighting may have long-term consequences. As longer wavelengths penetrate deeply, this may be of significance not only for the ageing eye, but also potentially for other tissues. Ethics statement. Fly research is free of legal ethical constraint. Data accessibility. All data are presented in the manuscript. Acknowledgement. We thank Iris Salecker, Giovanna Vinti and Tobi Weinrrich for technical assistance. Author contributions. G.J. designed experiments and wrote the manu- script. All authors undertook the experiments and approved the final version of the manuscript. R.B. analysed the data. Funding statement. Supported by the Rosetrees Trust UK. K.C. was a research fellow from CAPES Brazil (proc. 18134/12-2). Competing interests. We have no competing interests. References 1. Lopez-Otin C, Blasco MA, Partridge L, Serrano M, Kroemer G. 2013 The hallmarks of aging. Cell 153, 1194–1217. (doi:10.1016/ j.cell.2013.05.039) 2. Balaban RS, Nemoto S, Finkel T. 2005 Mitochondrial, oxidants and aging. Cell 120, 483–495. (doi:10.1016/j.cell.2005.02.001) 3. Speakman JR. 2005 Body size, energy, metabolism and lifespan. J. Exp. Biol. 208, 1717–1730. (doi:10. 1242/jeb.01556) 4. Wang Z, Ying Z, Bosy-Westphal A, Zhang J, Schautz B, Later W, Heymsfield SB, Mu¨ller MJ. 2010 Specific metabolic rates of major organs and tissues across adulthood: evolution by mechanistic model of resting expenditure. Am. J. Clin. Nutr. 92, 1369– 1377. (doi:10.3945/ajcn.2010.29885) 5. Yu DY, Cringle SJ. 2001 Oxygen distribution and consumption within the retina in vascularized and avascular retinas and in animal models of disease. Prog. Retin. Eye Res. 20, 175–208. (doi:10.1016/ S1350-9462(00)00027-6) 0 0 10 20 30 40 50 60 70 80 100 (a) (c) (d ) (b) % survival over controls n = 620 flies fly survival curves for 670 nm (–) and control (–) 90 123456 time (weeks) % survival 78910 0 0 100 200 300 123456 no. weeks % increase over control control distance travelled in 1 min 670 control 670 * 0 20 60 40 80 100 distance (mm) fly climbing (>90 mm) * 0 20 60 40 80 % >90 mm in 1 min 78910 11 12 Figure 2. Lifespan and mobility. (a) Fly numbers at progressive weeks in groups exposed to 670 nm supplemented light each day (red line) and controls (black line). Curves are averages for six independent experiments with a minimum of 40 flies per group in each experiment. Fly death rates separated between three and six weeks with fewer flies dying in 670 nm exposed animals. Reduction in the two population followed similar patterns from six weeks but with the 670 nm exposed group having greater numbers at any point until week 12. In all replicates, there was no indication that 670 nm increased absolute lifespan beyond weeks 11 – 12. Differences between the two groups were statistically significant ( p ¼ 0.008). (b) Inset: percentage increase of 670 nm exposed flies alive at pro- gressive weeks. (c) Seven week old 670 nm exposed flies were more active than controls. (d) Mobility measures the percentage of flies that climbed above 90 mm in a clear 100 ml cylinder. (d) This was filmed and then the distance travelled by each fly was measured in each group. In both cases, the 670 nm exposed flies where significantly more mobile. There were 21 flies in each group in each condition. (Online verion in colour.) rsbl.royalsocietypublishing.org Biol. Lett. 11: 20150073 3 on March 18, 2015http://rsbl.royalsocietypublishing.org/Downloaded from 6. Gkotsi D, Begum R, Salt T, Lascaratos G, Hogg C, Chau KY, Schapira AH, Jeffery G. 2014 Recharging mitochondrial batteries in old eyes. Near infra-red increases ATP. Exp. Eye Res. 122, 50 –53. (doi:10. 1016/j.exer.2014.02.023) 7. Fitzgerald M et al . 2013 Red/near-infrared irradiation therapy for treatment of central nervous system injuries and disorders. Rev. Neurosci. 24, 205–226. (doi:10.1515/revneuro-2012-0086) 8. Wilson M, Greenwood C. 1970 The long-wavelength absortion band of cytochrome c oxidase. Biochem. J. 116, 17 –18. 9. Karu TI, Pyatibrat LV, Kolyakov SF, Afanasyeva NI. 2005 Absorption measurements of cell monolayer relevant to phototherapy: reduction of cytochrome c oxidase under near IR radiation. J. Photochem. Photobiol. 81, 98– 106. (doi:10.1016/j.jphotobiol.2005.07.002) 10. Cooper CE, Springett R. 1997 Measurement of cytochrome oxidase and mitochondrial energetics by near-infrared spectroscopy. Phil. Trans. R. Soc. Lond. B 352, 669– 676. (doi:10.1098/rstb.1997.0048) 11. Kokkinopoulos I, Colman A, Hogg C, Heckenlively J, Jeffery G. 2013 Age-related inflammation is reduced by 670 nm light via increased mitochondrial membrane potential. Neurobiol. Aging 34, 602– 609. (doi:10.1016/j.neurobiolaging.2012.04.014) 12. Begum R, Powner MB, Hudson N, Hogg C, Jeffery G. 2013 Treatment with 670 nm up regulates cytochrome C oxidase expression and reduces inflammation in an age-related macular degeneration model. PLoS ONE 8, e57828. (doi:10. 1371/journal.pone.0057828) 13. Purushothuman S, Nandasena C, Johnstone DM, Stone J, Mitrofanis J. 2013 The impact of near- infrared light on dopaminergic cell survival in a transgenic mouse model of parkinsonism. Brain Res. 1535, 61 –70. (doi:10.1016/j.brainres.2013.08.047) 14. Bjedov I, Toivonen JM, Kerr F, Slack C, Foley A, Partridge L. 2010 Mechanisms of life span extension by rampamycin in the fruit fly Drosophila melanogaster. Cell Metab. 11, 35–46. (doi:10.1016/ j.cmet.2009.11.010) 15. Vernace VA, Arnaud L, Schmidt-Glenewinkel T, Figueiredo-Pereira ME. 2007 Aging perturbs 26S proteasome assembly in Drosophila melanogaster . FASEB J. 21, 2672–2682. (doi:10.1096/fj.06- 6751com) 16. Nonaka M, Kimura A. 2006 Genomic view of the evolution of the complement system. Immunogenetics 58, 701– 713. (doi:10.1007/ s00251-006-0142-1) 17. Celniker SE, Rubin GM. 2003 The Drosophila melanogaster genome. Annu. Rev. Genomics Hum. Genet. 4, 89–117. (doi:10.1146/annurev.genom.4. 070802.110323) 18. Harman D. 1981 The ageing process. Proc. Natl Acad. Sci. USA 78, 7124 –7128. (doi:10.1073/pnas. 78.11.7124) 19. Edgar D et al. 2009 Random point mutations with major effects on protein coding genes are the driving force behind premature aging in mtDNA mutator mice. Cell Metab. 10, 131–138. (doi:10. 1016/j.cmet.2009.06.010) 20. Hiona A et al. 2010 Mitcohondrial DNA mutations induce mitochondrial dysfunction, apoptosis and sarcopenia in skeletal muscle of mitochondrial mutator mice. PLoS ONE 5, e11468. (doi:10.1371/ journal.pone.0011468) 21. Doonan R, McElwee JJ, Matthijssens F, Walker GA, Houthoofd K, Back P, Matscheski A, Vanfleteren JR, Gems D. 2008 Against the oxidative damage theory of aging: superoxide disumatases protect against oxidative stress but have little or no effect on life span in Caenorhabditis elegans. Genes Dev. 22, 3236–3241. (doi:10.1101/gad. 504808) 22. Mesquita A et al. 2010 Caloric restriction or catalase inactivation extends yeast chronological lifespan by inducing H 2 O 2 and superoxide dismutase activity. Proc. Natl Acad. Sci. USA 107, 15 123–15 128. (doi:10.1073/pnas.1004432107) 23. Zhang Y et al. 2009 Mice deficient in both Mn superoxide dismutase and glutathione peroxidase-1 have increased oxidative damage and a greater incidence of pathology but no reduction in longevity. J. Gerontol. A Biol. Sci. Med. Sci. 64, 1212– 1220. (doi:10.1093/gerona/glp132) rsbl.royalsocietypublishing.org Biol. Lett. 11: 20150073 4 on March 18, 2015http://rsbl.royalsocietypublishing.org/Downloaded from
Original Source: https://www.researchgate.net/publication/273781783_Near-infrared_light_increases_ATP_extends_lifespan_and_improves_mobility_in_aged_Drosophila_melanogaster
TheraLazr Cold Laser Treatment of Parkinson Tremor
Dr. Stephen Riner D.C. - YouTube 2012 (Video) 4321Dr. Riner uses LLLT to treat a patient with Parkinsons, the video shows the progression of the treatment
This video shows before and after treatment footage of a patients with advanced Parkinsons. Treatment lasts about 2 weeks. Dr Riner is using the brain and neurostim setting on the brain, C5 Nerve Root and the Ulnar nerve in the elbow.
The TheraLazr is the prototype for the Avant LZ30 series of lasers.
video length: (2:03)
Original Source: https://www.youtube.com/watch?v=yOoV1AJ83-M
Epic 10 TMJ LLLT
- 2014 (Video) 4352A woman receives LLLT for her TMJ, and experiences no pain afterward, but the title promotes the Epic 10 laser, possible bias.
LLLT being used to treat a patient with TMJ. She experiences pain in her cheeks and neck particularly, and afterward claims to have no pain or discomfort. The doctor states that the LLLT has reduced inflammation, and relaxed the muscles that were causing the spasms.
video length: (2:43)
Original Source: https://www.youtube.com/watch?v=u28fAHZNRoQ
Oral Mucositis Academy of Laser Dentistry 2016
Annette Quinn - 2016 (Video) 4408After reviewing other treatment options like radiation, Annette talks about how extremely effective laser can be on oral mucositis
The laser info starts around 30 minutes into the presentation.
Original Source: https://www.youtube.com/watch?v=xU5_9169dbw
LLLT for spinal cord injuries presented by Prof Juanita Anders
Prof Juanita Anders - YouTube 2011 (Video) 4324This is a 17 minute long presentation of LLLT research done on rats, the video is however associated with Thor
The presentation includes research done on rats for the following conditions:
- Traumatic Brain Injury (TBI)
- Spinal Cord Injury
- Nerve regeneration
The research was supported by Thor so it could be biased but their research indicates that 810nm provides better stimulation of the cells.
video length: (17:09)
Original Source: https://www.youtube.com/watch?v=XxRIds1EKqk
Dr Burke, LLLT Patient Results
- 2014 (Video) 4354(GRAPHIC CONTENT) This relatively unbiased 14 minute long presentation focuses on the results of LLLT on multiple patients by Dr. Burke.
Dr. Burke shares some of his quite impressive results in patients who recieved LLLT, incuding:
- a woman with severe ulcers on her hand
- a horse with a leg wound
- an 88 year old woman with diabetes and an infected ulcer on her leg, soon to be amputated
- a 68 year old woman with a non-healing knee surgury wound
- a man with a 40 year old venous ulcer
- a woman with blood clots in her feet that led to gangreen, soon to be amputated
- a 12 year old girl with post herpetic Bell's Palsy
- a man with very bad leg fracture
- a woman with a jones fracture
video length: (13:46)
Original Source: https://www.youtube.com/watch?v=iJunHg5VFUM
THOR Low Level Laser Therapy LLLT Wound healing
- 2008 (Video) 4341This video is a news report on LLLT, and it shows some promising results on a year old non-healing hernia, the video was posted to youtube by thor, possible bias.
News report about the use of low level light therapy (LLLT) on a surgical wound that wouldn't heal after nearly a year in a patient with diabetes.
video length: (2:17)
Original Source: https://www.youtube.com/watch?v=faYpG_IOi08
LLLT treatment of Oral Mucositis
- 2008 (Video) 4348This is a news report that explains the basics of LLLT and we hear from a patient that it was used to treat Oral Mucositis, the video was posted by thor, could be biased
Young man with mucositis recieved a bone marrow transplant and was given LLLT both pre-, and post-op. He was expected to have serious mouth sores, but thanks to the LLLT he had minimal sores that quickly went away.
video length: (1:35)
Original Source: https://www.youtube.com/watch?v=9Mfrrga40yw
Pain Relief, Accelerated Healing with Laser Therapy, Chad Davis, DVM
- 2011 (Video) 4366This is a video of Chad Davis, DMV, demonstrating the use of LLLT on A horse, it was made using a multi radiance laser so it may be biased
Chad Davis, DVM, gives a demonstration of the effecacy of LLLT on a horse.
video length: (4:39)
Original Source: https://www.youtube.com/watch?v=nIwFJ2OHKms
RJ-LLLT in paralyzed dogs prevents surgery...
- 2014 (Video) 4344In this video you will see before and after LLLT on 3 different paralyzed dogs, made by RJ Lasers could be biased
This short video shows 3 before and after videos of paralized dogs who recieved LLLT and were able to walk again.
video length: (1:25)
Original Source: https://www.youtube.com/watch?v=McfHhMNo13I
Low Level Laser Therapy (LLLT): An Introduction
QB Medical - 2014 (Video) 4334This is a 12 minute introductory video to LLLT
This video discusses the basics of Low Level Laser Therapy. You will learn a little bit about lasers and laser history, and what makes a cold laser a cold laser. It also talks about the difference between lasers and LED's and why the latter may be less effective for medical therapy.
You'll find information on the treatment parameters of LLLT which are:
- wavelength
- power
- duty cycle (continueous or pulsed)
- energy density (dosage)
- treatment duration
It also goes over what indications the FDA has approved LLLT and infrared light for.
video length (12:13)
Original Source: https://www.youtube.com/watch?v=vnvOKXSLK8E
Introduction to LLLT
Dr. Michael Hamblin - 2009 (Video) 4340Dr. Hamblin is a Harvard professor and has been studying the effects of LLLT for many years, but he is also associated with Thor.
Dr. Michael Hamblin Talks about the differences between photodynamic therapy (PDT) and low level laser therapy (LLLT), and explains the basics of LLLT.
video length: (4:35)
Original Source: https://www.youtube.com/watch?v=7DdxPWmQPHk
Deep Tissue Laser Therapy Medical Animation
- (Video) 4320This video was produced by LightCure so it is biased but it has one of the coolest graphic representation of the photobiomodulation using a therapy laser.
In this video, you will see one of the better graphic representations of the photobiomodulation process including the release of ATP, NO, ROS.
This video was created by LightCure so at the end of the video, they try to make the point that class 4 laser are better than class 3 system. With the release of high-power class 3b (with power levels over 15 watts) system, this part of the video out of date.
video length: (3:08)
Original Source: https://www.youtube.com/watch?v=dB9MIW9fduk
Cold Laser Therapy of Knee Pain, Knee Sprains, Knee Tendinitis, and Chondromalacia Patella.
- 2013 (Video) 4382This video talks about what LLLT is and touches on the differences between class III and IV lasers for LLLT
Class IV K Laser is an excellent new treatment for helping muscle pulls, sprains, strains, and joint injuries. Cold Laser is a great treatment for speeding the recovery of knee pain, chondromalacia patella, patella tendonitis, and knee sprains. Lasers help increase cellular ATP, which is the cells energy source. Cells use the increased energy for healing and repair. Lasers are also excellent at increasing metabolic and repair process within the tissue. They decrease inflammation and pain around muscles, tendons, and joints. In addition, the speed recovery and healing of nerves, especially pain nerves.
video length: (1:51)
Original Source: https://www.youtube.com/watch?v=joh2jlWErsY&nohtml5=False
Cold Laser Therapy Treatment for Neuropathy caused by Diabetes
- 2013 (Video) 4387Dr. Adam Zuckerman talks about his use of LLLT in patients with diabetes.
Dr. Adam Zuckerman talks about his use of LLLT in patients with diabetes.
video length: (1:46)
Original Source: https://www.youtube.com/watch?v=pmDVhtNqJXA&nohtml5=False
Ron Hirschberg DVM veterinarian, interview about LLLT low level laser therapy
Ron Hirschberg - 2013 (Video) 4347In this 13 minute video Ron Hirschberg, DMV, tells of his personal experience with LLLT, and on to his use of LLLT in his veterinary practice, the video is made by thor, so it could be biased
Veterinarian Ron Hirschberg tells of how he first experienced laser therapy on his own arthritis, and decided to invest in lasers for his practice. Since he started using laser therapy on the pets he works with he has seen many positive results, he explains that gross profits from NSAIDs decreased from 0.71% to 0.3%, and laser profit now makes up 4% of the practice's income. He will treat between 3 and as many as 13 patients with LLLT, 95% of which he says improve noticably faster than those without LLLT.
viedo length: (13:37)
Original Source: https://www.youtube.com/watch?v=MLmE8QE27Ew
Recovery, Training and the Olympic Trials with NovoTHOR
Thor Lasers - Youtube (Video) 4472This is a marketing video for the NovoThor staring several several Olympic athletes.
Original Source: https://www.youtube.com/watch?v=pIyjKwi1aVg
Lyme Laser Centers of New England - Hanna
Lyme Laser Centers of New England - Youtube (Video) 4473Here is a testmonial for using laser therapy to treat lyme disease.
Original Source: https://www.youtube.com/watch?time_continue=1&v=vudIKG7Bf7E
Lyme Laser Centers of New England - Lauren
Lyme Laser Centers of New England - Youtube (Video) 4474Here is a testmonial for using laser therapy to treat lyme disease.
Original Source: https://www.youtube.com/watch?time_continue=1&v=vudIKG7Bf7E
Lyme Laser Centers of New England - Sarah
Lyme Laser Centers of New England - Youtube (Video) 4475Here is a testmonial for using laser therapy to treat lyme disease.
Original Source: https://www.youtube.com/watch?v=Sf8kL-AoSBY
Lyme Laser Centers of New England - Meghan
Lyme Laser Centers of New England - Youtube (Video) 4476Here is a testmonial for using laser therapy to treat lyme disease.
Original Source: https://www.youtube.com/watch?v=6UiPCdKpSoU
ATP: Adenosine Triphosphate
Bozeman Science - Youtube Educational Video (Video) 4507This is a great introductory video about why ATP is the currency of life.
Spokane Chiropractor, Chiropractic Lifecenter, Cold Laser Therapy
- 2010 (Video) 4374This is a short video demonstration of LLLT on a woman with restricted motion in her shoulders
In this video Spokane Chiropractor Dr. Patrick Dougherty gives a quick demonstration of how cold laser therapy is used as a chiropractic treatment to help with range of motion by affecting the nervous system. This can be used as an effective adjunct to chiropractic adjustments when the brain is having a difficult time holding on to the input that the adjustments provides to the brain.
video length: (4:34)
Original Source: https://www.youtube.com/watch?v=vzGqgzKC76I&nohtml5=False
How LLLT Works
- (Video) 4337This is an animation that helps to explain the processes behind LLLT, it is made by Thor so it may be biased
This short animation from gives a simple description of how LLLT effects individual cells and things like:
- cytochrome c oxidase
- oxygen
- NADH
- Nitric oxide
- ATP
video length: (1:21)
Original Source: https://www.youtube.com/watch?v=VzMJUxalkFo
Cold Laser Therapy for Pain, Arthritis, Neck Pain
- 2011 (Video) 4373Dr. Larry Lytle discusses LLLT, particularly for pain in an interview.
Dr. Larry Lytle discusses LLLT, particularly for pain in an interview.
video length: (27:37)
Original Source: https://www.youtube.com/watch?v=VocXsehAb2c&nohtml5=False
Dr. Victor Dolan Demonstrates Cold Laser Therapy
- 2011 (Video) 4383Dr. Dolan demonstrates LLLT on a sore back, while describing how LLLT works.
Cold Laser Therapy can be very effective for those suffering from pain caused by auto accidents. Cold Laser Therapy is equally effective for those suffering from pain caused by work-related accidents. Athletes get great relief from sports-related injuries using Cold Laser Therapy. Cold Laser Therapy is a powerful therapy in the battle to relieve back pain, neck pain and joint pain.
Importantly, studies to date indicate that Cold Laser Therapy has no serious side effects when used by a trained healthcare professional. It is a non-invasive procedure requiring no surgical incision. There is no recovery time after a treatment. You do not have to take any medications relating to Cold Laser Therapy.
video length: (5:49)
Original Source: https://www.youtube.com/watch?v=paixoR44Bv0&nohtml5=False
LLLT Neck Pain Treatment
- 2008 (Video) 4342A video of an LLLT procedure for neck pain
Using LLLT to treat neck pain, procedure without wavelength or power, or any other laser parameters given.
video length: (1:14)
Original Source: https://www.youtube.com/watch?v=0gb0m1uFbhU
Cold Laser Therapy Demonstration? Austin Natural Family Medicine
- 2010 (Video) 4372Dr. Fritz describes what LLLT is while giving a basic demonstration of the process
Dr. Fritz teaches Obstetrics & Gynecology at the Academy for Oriental Medicine in Austin.
After getting undergraduate and graduate degrees in Biology from the University of Virginia, Dr. Vanessa Fritz graduated from the National College of Natural Medicine in Portland, Oregon, with a doctorate in Naturopathic Medicine (ND) as well as a Master of Science in Oriental Medicine (MSOM).
video length: (9:32)
Original Source: https://www.youtube.com/watch?v=mS6-o_iBDGE&nohtml5=False
Introduction to Cold Laser Therapy
- 2016 (Video) 4393Dr. Christensen shares an introduction to cold lasers, their benefits and many uses
LLLT presentation HD
- 2015 (Video) 4359This 20 minute long video presentation gives a basic description of LLLT and a list of dental issues LLLT has been used to treat, the video is specific to zolar laser, so it may be biased
This video gives a somewhat in-depth list of dental issues that LLLT can be used to treat and how to treat them, along with a simple explaination of what LLLT is. At (16:48) there is a demonstration on how to use a Zolar laser for LLLT.
video length: (19:49)
Original Source: https://www.youtube.com/watch?v=ZJIEx9qemhk
K-Laser Mechanism of Action, Animal
- 2012 (Publication) 4399This is a great K-laser graphic review of the mechanism for 970nm increasing circulation and 905nm for boosting oxygen and 800nm for boosting cytrochrome oxydase to produce more ATP.
This video shows how red laser light interacts with blood and it talks in detail about the chemical process.
K-Laser Mechanism of Action, Animal from K-LaserUSA on Vimeo
Original Source: https://vimeo.com/49623761
Plantar Fasciitis, Achilles Tendonitis, Morton’s Neuroma - LLLT treatment using the FOX Laser
- 2015 (Video) 4358This is a video demonstration of how to use a fox laser for LLLT for foot problems
LLLT is known to dramatically improve conditions associated with soft tissue inflammations, not only by reducing pain, but also by providing a significant therapeutic advantage resulting in inflammation reduction, as well as expediting the healing process.
- Plantar fasciitis is an inflammation of the band of tissue (the plantar fascia) that extends from the heel to the toes. In this condition, the fascia first becomes irritated and then inflamed, resulting in heel pain. The most common cause of plantar fasciitis relates to faulty structure of the foot. Wearing non-supportive footwear on hard, flat surfaces puts abnormal strain on the plantar fascia and can also lead to plantar fasciitis.
- Achilles tendinitis is an overuse injury of the Achilles tendon, the band of tissue that connects calf muscles at the back of the lower leg to your heel bone. The structure of the Achilles tendon also weakens with age, which can make it more susceptible to injury — particularly in people who may participate in sports only on the weekends or who have suddenly increased the intensity of their running programs
- A neuroma is a thickening of nerve tissue that may develop in various parts of the body. The most common neuroma in the foot is a Morton’s neuroma, which occurs between the third and fourth toes. It is sometimes referred to as an intermetatarsal neuroma. Morton's neuroma seems to occur in response to irritation, pressure or injury to one of the nerves that lead to the toes.
video length: (3:25)
Original Source: https://www.youtube.com/watch?v=q4ASHpHcn8w
A guy with dentine hypersensitivity treated with LLLT
- 2015 (Video) 4362A man who has just been treated with LLLT for his dentine hypersensitivity, video posted by Thor so it could be biased
A man experiencing tooth sensitivity atests to pain reilief from LLLT.
video length: (0:54)
Laser Therapy Review Pain Management - Dr. Bernard Filner MD - Microlight ML830® Laser
- 2011 (Video) 4370Dr. Bernard Filner MD Discusses his use of LLLT in pain management, but the video is made by microlight so it may be biased
Dr. Bernard Filner MD Discusses his use of LLLT in pain management.
video length: (2:48)
Original Source: https://www.youtube.com/watch?v=fIlU4QDAuW0&nohtml5=False
How Theralase Laser Technology Works
Theralase - 2016 (Video) 4405This is a biased promotional video but the graphic are a good intro to the chemical process.
Original Source: https://www.youtube.com/watch?v=WeVBt5Ud_DM
Quantitative In Vivo Imaging of Tissue Absorption, Scattering, and Hemoglobin Concentration in Rat Cortex Using Spatially Modulated Structured Light
David J. Cuccia, David Abookasis, Ron D. Frostig, and Bruce J. Tromberg. - 2009 (Book) 450212.1. INTRODUCTION
Significant changes in blood flow or in the integrity of cerebral vessels are believed to cause cerebrovascular disease (CVD) and to contribute to dementias including Alzheimer’s disease [1]. Stroke, the most serious form of CVD, is one of the leading causes of death and adult disability worldwide. Acute treatments for stroke, however, are severely limited. Neuroprotective drugs under development show promise at halting the ischemic cascade, but as yet, no such compound has received federal approval in the United States. One of the biggest limitations to this development is the lack of understanding of the mechanisms by which cerebral vessels react to factors such as ischemia, inflammation, blood pressure changes, metabolic demands, and trauma [2]. In order to address these fundamental questions, functional brain imaging techniques such as fMRI and intrinsic signal optical imaging (ISOI) have emerged as tools to visualize and quantify cerebral hemodynamics.
In the neuroscience community, ISOI has long been used to study the organization and functional architecture of different cortical regions in animals and humans [3–5] (see other chapters in this book). Three sources of ISOI signals that affect the intensity of diffusely reflected light derive from characteristic physiologic changes in the cortex. For functional neuronal activation, these have been observed to occur over a range of timescales, including (1) light scattering changes, both fast (over 10 s of milliseconds) and slow (i.e., > ~0.5 s) (2) early (~0.5–2.5 s) absorption changes from alterations in chromophore redox status, i.e., the oxy/deoxy-hemoglobin ratio (known as the “initial dip” period), and (3), slower (~2–10 s) absorption changes due to blood volume increase (correlated with the fMRI BOLD signal). Light scattering changes have been attributed to interstitial volume changes resulting from cellular swelling, organelle swelling due to ion and water movement, capillary expansion, and neurotransmitter release [6,7]. The slower absorption factors have been demonstrated to correlate with the changes in metabolic demand and subsequent hemodynamic cascades following neuronal activation [4,8,9].
Using animal models of acute and chronic brain injury, ISOI has been used to quantify the acute hemodynamic events in response to stroke, including focal ischemia and cortical spreading depression (CSD) [10–21]. Researchers have also used ISOI to locate and quantify the spatial extent of the stroke injury, including ischemic core, penumbra, and healthy tissue zones [18,22]. CSD also plays a key role in migraine headache, and recent laser speckle imaging studies have revealed the neurovascular coupling mechanism to the transmission of headache pain [23,24].
To fully understand the underlying mechanisms in vascular changes associated with cerebrovascular diseases such as stroke, an optical imaging technique that has the capability to rapidly separate absorption from scattering effects can enhance the information content of traditional ISOI, enabling (1) more accurate quantitation of hemodynamic function, (2) isolation of the electro-chemical changes characterized by light scattering, and (3) longitudinal chronic injury studies of function where structural reorganization due to neovascularization can cause significant alterations in scattering [25,26].
Quantitative diffuse optical methods [27] such as spatially-resolved reflectance, diffuse optical spectroscopy (DOS), and tomography (DOT), and diffuse correlation spectroscopy (DCS) possess exquisite sensitivity to these functional and structural alterations associated with brain injury, and have been applied to the study of CSD [11,15,28]. DOS and DOT utilize the near-infrared spectral region (600–1000 nm) to separate and quantify the multispectral absorption (μa) and reduced scattering coefficients (μs′), providing quantitative determination of several important biological chromophores such as deoxy-hemoglobin (HbR), oxy-hemoglobin (HbO2), water (H2O), and lipids. Concentrations of these chromophores represent the direct metrics of tissue function such as blood volume fraction, tissue oxygenation, and edema. Additionally, the scattering coefficient contains important structural information about the size and density of scatterers and can be used to assess tissue composition (exctracellular matrix proteins, cell nuclei, mitochondria) as well as follow the process of tissue remodeling (wound healing, cancer progression). DOS utilizes a limited number of source-detector positions, e.g., 1–2, but often employs broadband content in temporal and spectral domains [29]. In contrast, DOT typically utilizes a limited number of optical wavelengths (e.g., 2–6) and a narrow temporal bandwidth, but forms higher resolution images of subsurface structures by sampling a large number of source-detector “views.” To achieve maximal spatial resolution, the ideal DOT design would employ thousands of source-detector pairs and wavelengths. However, several engineering considerations including measurement time and instrument complexity currently limit the practicality of this approach.
In this chapter we present the basic principles of a new, noncontact quantitative optical imaging technology, modulated imaging (MI) [30–32], and provide examples of MI performance in 2 rat models of brain injury, cortical spreading depression (CSD) and stroke. MI enables both DOS and DOT concepts with high spatial (<1 mm) and temporal resolution (<1 s) in a simple, scan-free platform. MI is capable of both separating and spatially-resolving optical absorption and scattering parameters, allowing wide-field quantitative mapping of tissue optical properties. While compatible with time-modulation methods, MI alternatively uses spatially modulated illumination for imaging of tissue constituents. Periodic illumination patterns of various spatial frequencies are projected over a large area of a sample. The diffusely reflected image is modified from the illumination pattern due to the turbidity of the sample. Typically, sine-wave illumination patterns are used. The demodulation of these spatially modulated waves characterizes the modulation transfer function (MTF) of the material, and embodies the sample optical property information.
12.2. METHODS AND INSTRUMENTATION
12.2.1. Modulated Imaging Spectroscopy
The MI instrument platform was introduced originally by Cuccia et al. [30] Based on this design, we have developed a custom multispectral near-infrared (NIR) MI spectroscopy system capable of imaging between 650 and 1000 nm. A diagram of this system is shown in Figure 12.1.
FIGURE 12.1
Modulated imaging platform. QTH—quartz tungsten halogen; L1—aspheric condenser; H—hybrid hot mirror; DMD—digital micromirror device; L2—projection lens; L3—camera lens; LCTF—liquid crystal tunable (more...)
Broadband NIR illumination is provided by an intensity-stabilized 250 W quartz-tungsten-halogen (QTH) lamp (Oriel QTH Source with Light Intensity Controller, Newport Corporation-Oriel Instruments, Stratford, Connecticut). Light is collimated and refocused with a pair of aspheric F/#0.7 optical lens systems (Oriel Aspherab). A custom-sized 3.5 in square hybrid hot mirror (Reynard Corporation, i.e., R00670-00) was placed between the lenses to limit the illumination to wavelengths below 1000 nm. Light engine optics taken from a digital projector (NEC HT1000) serve to homogenize and direct the light onto a 0.7 in digital micromirror device (DMD Discovery™ 1100 with ALP Accessory Package, ViALUX, Germany). Grayscale spatial sinusoid patterns are projected at 400 Hz using the ViALUX software development toolkit, which generates the necessary pulse-width modulation of binary sub-frames to produce a specified grayscale bit-depth (1–8 bits). Finally, a fixed focal length (f = 100 mm) projection lens illuminates the tissue at a slight angle from normal with a 15 × 25 mm illumination field. Detection was performed at normal incidence using a CRI Nuance™ camera system, which combines a 12-bit CCD camera and a liquid crystal tunable filter (LCTF; λ = 650–1100 nm, Δλ = 10 nm). To avoid specular reflection, crossed linear polarizers are used in the illumination and detection arms. For this system, the former is a 1.5 in diameter NIR linear polarizer (Meadowlark Optics, VLM-200-IR-R) placed immediately after the projection lens, and the first stage of the Nuance LCTF serves as the latter. The DMD, CCD, and LCTF are controlled via USB by a laptop computer, and synchronized using LabVIEW software (LabVIEW 8, National Instruments), enabling fast acquisition of a series of patterns with various spatial frequencies.
12.2.2. SFD Measurement, Calibration, and Modeling
A detailed description of SFD measurement, calibration, and diffusion modeling is provided by Cuccia [32]. In this work, we modeled diffuse reflectance using a transport-based White Monte Carlo (WMC) method [33,34]. Previously, we have found that compared with Monte Carlo, (1) diffusion predictions over- and underestimate low- and high-frequency diffuse reflectance, respectively, and (2) the quantitative accuracy of diffusion degrades with decreasing albedo [32]. Due to the moderate albedo of brain tissue (μs′/μa ~ 10–20), we chose to analyze all brain data with the WMC approach. This homogeneous tissue model is a significant simplification of the multilayered rat brain, and more work is necessary to accurately model this complex system. We discuss further the consequences of our simple model in Section 12.2.5.
12.2.3. Optical Property Inversion Methods
In this chapter, we use two inversion methods to calculate the absorption and reduced scattering from measurements of diffuse reflectance. When high measurement precision is desired, we use a “sweep” in spatial frequency space, producing an overdetermined set of diffuse reflectance measurements, which can be fitted to our WMC forward model predictions using least-squares minimization. This method is performed for all spatially averaged region analysis of optical properties and chromophores. When increased acquisition and/or processing speed is desired, we alternatively use a rapid two-frequency lookup table method based on cubic spline interpolation [32]. This data can be achieved with a minimal 3-phase, single frequency image set (by demodulating and averaging the images to obtain AC and DC amplitude maps, respectively). On typical personal computers this approach is capable of millions of inverse lookup calculations per second, and is therefore used to calculate all high-resolution images including time sequences. The signal-to-noise ratio (and thus the measurement precision) of either approach is limited by the data sampling, with the two-frequency method having a lower precision with the tradeoff of higher acquisition and processing speed.
12.2.4. Spectral Analysis-Chromophore Calculation
The quantitative absorption coefficient is assumed to be a linear (Beer’s law) summation of individual chromophore absorption contributions:
where ci and ?i(λ) represent chromophore concentrations and molar extinction coefficients, respectively. Using reported extinction coefficients of HbO2/HbR35 and H2O,36 we can invert Equation 12.1 and calculate tissue chromophore concentration separately at each pixel by linear least-squares fitting to the multispectral absorption images. Total hemoglobin (HbT) and oxygen saturation (StO2) can then be calculated as HbT = HbR + HbO2 and StO2= HbO 2/(HbR + HbO2) * 100, respectively.
12.2.5. Optical Property Mapping: Resolution Versus Quantitation
On a pixel-by-pixel basis, diffuse reflectance versus spatial frequency is fitted to the WMC forward model to extract the local absorption and reduced scattering optical property contrast. This process is repeated for each wavelength, resulting in multi-spectral absorption and scattering spectra at each pixel. The measured contrast from discrete absorbers and scatterers on millimeter and submillimeter spatial scales, however, will possess partial volume effects in all three spatial dimensions. This is due to the physical light transport length scales in tissue, limiting the true x-y resolution of optical property contrast to many detector pixels [32]. This phenomenon is not unique to MI, but present in all planar reflectance imaging measurements of turbid media. Absorption and scattering are calculated using a homogeneous reflectance model, extracting a locally averaged sampling of optical property contrast. Based on simulations of the tissue MTF for varying optical properties [32], we expect the resulting image resolution to scale directly with the transport length, l* = (μa + μs′)− 1, and the spatial frequency of illumination. In this chapter, we place quantitative emphasis on average optical properties and chromophores measured over a field of view that is greater than l*. Spatial maps and videos of these parameters are displayed and referred to as “contrast maps,” with the caveat that high resolution features will exhibit degraded quantitative accuracy.
12.2.6. In Vivo Rat CSD Experiments
12.2.6.1. Animal Preparation
MI spectroscopy measurements were performed on an in vivo Wistar rat model with a thinned-skull preparation. All procedures were performed in accordance with approved IACUC protocol guidelines. The animals were anesthetized, placed in a stereotaxic frame, their skulls thinned and glass coverslip applied. This preparation is described in detail by Masino et al. [37] The resulting thinned skulls allowed direct imaging of the cortex over a 5 × 7 mm field-of-view (whisker barrel cortex, centered at the C2 location). In order to investigate the sensitivity of MI toward studying acute cortical injury, we induced cortical spreading depression (CSD) by applying 1 M KCl solution to the surface of the cortex through a perforated section of skull and dura, located approximately 3 mm above the camera’s imaging field.
12.2.6.2. MI Measurement Protocol
For each of three animals, our MI measurement protocol was twofold. Prior to CSD induction, baseline spatial modulation data were acquired at 6 spatial frequencies (3-phase projections each) from 0 to 0.26 mm−1, at 10 nm intervals over the entire range between 650 and 980 nm. Depending on the wavelength, image acquisition times ranged from 200 ms to 4 s, with total spectral imaging time of approximately 30 s per spatial pattern. The entire measurement (34 wavelengths, 3 phases, 6 frequencies) was repeated three times for statistical averaging yielding an entire measurement time of approximately 30 min.
Next, rapid dynamic measurements were performed, beginning 1 min prior to K+Cl− administration. Here, a significantly reduced data set was chosen in order to achieve high temporal resolution. Two spatial frequencies (0 and 0.26 mm−1) were acquired with three phase projection images, as described in Section 12.2.2, at each of four wavelengths (680, 730, 780, and 830 nm). The resulting 12 images took in total 6 s, permitting a repetition rate of 10 measurements per minute. The animals were followed for a period of 10 min for rats 1 and 2, and a period of 30 min for rat 3.
All images in this study were smoothed by 2D convolution with a Gaussian filter function (FWHM = 3 pixels), and baseline repetitions were averaged prior to data processing. Additionally, time-series data were post-processed by smoothing slightly in time (Gaussian FWHM of 2 timepoints = 12 s).
12.2.6.3. Spatial Frequency Sensitivity Analysis
Because of the differential absorption sensitivity at low and high frequencies, optimal optical property separation is achieved when a large range of frequencies is used [31]. In Figure 12.2a, we depict this differential sensitivity using diffuse reflectance (MTF) predictions versus frequency, increasing μa by 100% from 0.02 (black line) to 0.04mm−1 (gray line). This is done for two values of μs′, 0.6 (solid lines) to 1.2mm−1 (dashed lines), simulating a 100% change in scattering. Notice that the low frequencies have a significant reflectance change due to absorption, while high frequency reflectance remains nearly unchanged. Conversely, reflectance changes due to scattering are observed at all spatial frequencies. In Figure 12.2b, we further visualize this by plotting the reflectance sensitivity to 1% changes in absorption and scattering. Whereas DC reflectance is equivalently sensitive to a fractional change in either absorption or scattering, at high spatial frequencies absorption contrast is lost while scattering contrast is retained. For instance, notice that at our maximum measurement frequency of 0.26 mm−1 the reflectance is roughly 24 times more sensitive to scattering compared to absorption (ΔRd = 0.56 μs′ versus 0.024 * 10−3 for μa). This plays an important role in Section 12.3.2 during our discussion of dynamic scattering measurement.
FIGURE 12.2
(a) Reflectance contrast in absorption and scattering covering a typical range of brain optical properties. (b) The frequency-dependent sensitivity to absorption (black line) and scattering (gray line), respectively. Reflectance at fx = 0.26 mm−1 (more...)
In realistic heterogeneous tissues, a tradeoff exists between maximizing the frequency range for optical property accuracy and obtaining similar sampling volumes. As tissue is a low-pass spatial filter, high frequencies are attenuated quickly with depth. Using diffusion-based forward modeling, we have estimated mean sampling depths at 650 nm using measured average background optical properties of brain tissue. This was done by predicting the depth sensitivity to contrast from a planar perturbation in absorption, given a background fluence profile from spatial frequencies 0 and 0.26 mm−1. Based on these results, we observe qualitatively similar depth sampling, with mean depth sampling ranging between 2.5 mm and 1.2 mm (for fx = 0 and 0.26 mm−1, respectively). In all cases maximal sensitivity was found in the first 1–2 mm, where cortical hemodynamic changes occur.
12.3. RESULTS AND DISCUSSION
12.3.1. Baseline MI Spectroscopy
In Figure 12.3a we show a grayscale planar reflectance image of the cortical region of rat 1 at 650 nm. A dotted-line box denotes the region-of-interest (ROI) used for analysis, selected for its uniform illumination and the absence of cerebral bruising. The Monte Carlo-model fitting of spatial frequency data allows calculation of the absorption and reduced scattering coefficients. In Figure 12.3b we show the spatially averaged diffuse reflectance at 650 nm and the corresponding multi-frequency fit. Excellent agreement is observed between measurement data and the model-based fit, with derived μa and μs′ coefficients of 0.033 and 0.70 mm−1, respectively.
FIGURE 12.3
(a) Reflectance map for rat 1, showing the 3.8 × 5.9 mm region chosen for quantitative analysis. (b) Sample MTF reflectance data (squares) and fit (solid line) at 650 nm. (c) Recovered optical property maps (above) and corresponding image histogram (more...)
Analysis of multifrequency reflectance data separately at each pixel results in spatial maps of absorption and reduced scattering contrast. In Figure 12.3c, we plot the μa and μs′ maps recovered at 650 nm for rat 1. Note the strong absorption in the vein region, due to a large absorption by HbR at this wavelength. Below the images, we show histogram distributions of the corresponding quantitative maps above, indicating the degree of spatial variation in recovered optical properties. The mean and standard deviation for the pixel-wise μa and μs ′ were 0.030 ± 0.007 mm−1 and 0.63 ± 0.13 mm−1, respectively. These statistical results are in good agreement with the spatially averaged reflectance fit from Figure 12.3b, suggesting that our simple pixel-wise fitting approach yields optical properties similar to that calculated using a global analysis.
By mapping the absorption coefficient at multiple wavelengths, we can perform quantitative spectral imaging of tissue. In Figure 12.4, we summarize the baseline spectroscopy results for all three animals. In Figure 12.4a we show the μa (left) and μs′ (right) coefficients versus wavelength (circles) recovered from spatially averaged fitting. Data for rat 1 is shown in black (rat 2 in dark gray; rat 3 in light gray). Note the distinct spectral features in absorption, resulting from oxy- and deoxy-hemoglobin (HbO2, HbR), and water (H2O) absorption. The calculated scattering coefficient generally decays with increasing wavelength, and the results from a power law (μs ′ = A·λ(nm) −b, solid lines) fit are shown. A small residual coupling is observed between measured scattering and absorption spectral features. In particular, the scattering at the shortest and longest wavelengths appears to be underestimated by 5–10%, occurring where the corresponding absorption is highest (due to HbR and H2O, absorption features, respectively). Based on our experiments in layered tissue phantoms [38], we believe this effect is primarily due to frequency-dependent probing volumes in the presence of depth-heterogeneous structures.
FIGURE 12.4
(a) Average μa (left) and μs′(right) spectra over entire ROI (circles). HbO 2, HbR, and H2O concentrations are determined by subsequent least-squares fitting (solid lines) of molar extinction coefficients to the absorption. Data (more...)
Simultaneous linear fitting of the absorption to known extinction coefficients yields measures of chromophore concentration. Shown in Figure 12.4a, multispectral fitting (solid line) for rat 1 yields HbO2, HbR, H2O, HbT and StO2 values of 56.3 μM, 33.2 μM, 63.9%, 89.6 μM, and 56.3%, respectively. Tabulated results of chromophore values for all three animals are shown in Figure 12.4b. Lipid absorption near 930 nm was not apparent in the μa spectrum, and when included in the spectral analysis was not found to significantly affect the results. The small absorption “bump” at 900–910 nm is an artifact of imperfect phantom calibration due to the presence of a sharp, strong silicone absorption peak that is present in the phantom.
We note that the solution for chromophore concentration is well-determined when the number of wavelengths is at least equal to the number of chromophores. Therefore, as few as two wavelengths can be used to separate HbO2 and HbR (if a constant value of H2O is assumed). Repeating the above analysis with 780 and 830 nm only (assuming H2O = 65%) yields results for HbO2 and HbR within 10% of those from full spectral fitting. Repeating the above analyses using a simple diffusion-based model provided qualitatively similar results for absorption and scattering spectra, but in general was found to overestimate the absorption coefficient by 10–25%.
Absorption spectra at each pixel can be separately analyzed to yield spatial maps of local HbO2, HbR, and H2O distribution, shown in Figure 12.5. Notice the high concentration of HbR over the large superficial draining vessel (venous) regions, also reflected in the StO2 image, highlighting the effect of tissue oxygen extraction. Conversely, notice that the high albedo regions with less structural detail are highly oxygenated, with StO2 levels between 60 and 70%. Lastly, the H2O map reveals a relatively homogeneous distribution of water.
FIGURE 12.5
Chromophore fits to absorption spectra at each pixel yield maps of local HbO2, HbR, and H2O concentration (left). Total hemoglobin (HbT) and oxygen saturation (StO2) maps can then be calculated from HbO2 and HbR.
12.3.2. Dynamic MI Spectroscopy of CSD
We performed measurements of CSD in each of the three rats, as described in Section 12.2.3. The results are presented as follows. We first present data for a single animal, choosing rat 3 for its long observation period of 30 minutes. Three ROIs are selected for analysis, and baseline MI spectroscopy results are reported for each of these regions. Next, the observed dynamic time courses of diffuse reflectance, optical properties, and chromophore concentrations are shown for each ROI. We then present the full spatio-temporal dynamic contrast data for rat 3 (2D + time) in the form of “snapshot” images.
Figure 12.6 summarizes the baseline spectroscopy measurements for rat 3. In Figure 12.6a, we show three regions of interest superimposed on the DC reflectance map, chosen to highlight three different characteristic temporal profiles observed within the field of view. In Figure 12.6b we show the baseline spectral fits for each of these regions, and in Figure 12.6c we tabulate the resulting calculated chromophore concentrations. In general, Region A (black) is a high albedo region lacking any large blood vessels, whereas Regions B (dark gray) and C (light gray) include high-absorption blood vessels and mild cerebral bruising from surgery. These differences are apparent in their recovered absorption spectra and fits, with on average 27% higher HbT, and 32% lower saturation in the vascular regions. Also, 7% higher H2O is found in Regions B and C, which may indicate increased edema due to bruising.
FIGURE 12.6
Regionwise spectral analysis of rat 1 baseline data including the respective (A) ROIs, (B) spectral absorption data (circles) and fit (lines), and (C) tabulated recovered chromophore data for each region
In Figures 12.7–12.9 (for regions A–C, respectively), we present the temporal dynamics of CSD in each ROI of rat 3 as measured by MI. In part (a) of each figure, we plot the multispectral diffuse reflectance changes at fx = 0 mm−1 (DC, top) and fx = 0.26 mm−1 (AC, bottom). In part (b), we plot the recovered Δμa (top) and Δμs′ (bottom) optical properties at each wavelength. While absolute values of diffuse reflectance and optical properties are measured separately at each time point, for visualization purposes all data are displayed as a change from that prior to KCl administration. Absolute optical property values at t = 0 (not shown) demonstrate excellent agreement (~5–10%) with full multifrequency baseline data.
FIGURE 12.7
(A) Multispectral diffuse reflectance at DC (fx = 0 mm−1, top) and DC (fx =.26 mm−1, bottom) for Region A of rat 3 over approximately 30 min. (B) Corresponding recovered multispectral absorption (top) and reduced scattering (bottom) coefficients. (more...)
FIGURE 12.8
(A) Multispectral diffuse reflectance at DC (fx = 0 mm−1, top) and DC (fx = 0.26 mm−1, bottom) for Region B of rat 3 over approximately 30 min. (B) Corresponding recovered multispectral absorption (top) and reduced scattering (bottom) (more...)
FIGURE 12.9
(A) Multispectral diffuse reflectance at DC (fx = 0 mm−1, top) and DC (fx = 0.26 mm−1, bottom) for Region C of rat 3 over approximately 30 min. (B) Corresponding recovered multispectral absorption (top) and reduced scattering (bottom) (more...)
Looking first at the reflectance time courses of Figure 12.7a (Region A), we see in general a series of three CSD events over the 30 minutes, with each transient event occurring for approximately 4.3 minutes. The first event occurs at minute 2.9 after KCl application, indicating an initial latency between the insult and the first resulting spreading depression wave. Reflectance contrast is present in both DC and AC frequency components, but with markedly different signatures. Generally, the DC time course shows a slow, gradual decay, punctuated by sharp, wavelength-dependent spikes/dips (for short/long wavelengths, respectively). Alternatively, the AC signature contains three sets of transient dips consistent across all wavelengths, with final values leveling off progressively lower than baseline. Discussed in detail in the following paragraph, we believe these AC changes are due primarily a result of optical scattering and may be related to neuronal depolarization. The corresponding derived optical properties in Figure 12.7b reflects this, with μs′ trends tracking directly with the measured AC reflectance. As expected, μa trends reveal similar wavelength-dependence of the DC reflectance (with opposite polarity), reflecting changes in HbO2 and HbR.
In Section 12.2.3.3 we noted that the diffuse reflectance at fx = 0.26 mm−1 is 23 times more sensitive to scattering changes compared to absorption. In this context, we propose that the observed magnitude of the CSD-induced AC reflectance changes can only be explained by changes in optical scattering. To concretely illustrate this point, we pick as an example the observed 780 nm AC diffuse reflectance dip in Figure 12.7a at t = 3.7 min of -0.003. Here, the corresponding change in reduced scattering in Figure 12.7b, Δμs′, is calculated to be −0.03 mm−1. In order for this change to instead be due to an absorption-only event, μa would need to increase by 121% from baseline (from 0.038 to 0.084 mm−1). This increase would also need to be accompanied by a drop in Rd (fx = 0 mm−1) of 0.12 (33%), whereas the actual observed DC reflectance only drops by 0.008 (<1%) and thus cannot explain the change. Secondly, we note that the three sets of AC reflectance dips occur consistently across all four wavelengths. While an approximate 120% increase in HbT could induce this decrease at high frequency, it would also require a large broad-wavelength decrease in the DC reflectance. We instead observe during these events that the DC increases at short wavelengths while the DC decreases at long wavelengths, suggesting primarily an exchange between HbO2 and HbR volume fractions, as opposed to a dramatic HbT change.
Regions A–C (Figures 12.7–12.9) were chosen to highlight three different time signatures observed in the field of view during the CSD dynamics. The most contrasting feature between all three regions is the measured AC reflectance and the derived scattering coefficient. In Region B (Figure 12.8), each CSD event appears to cause a biphasic scattering change, with a sharp increase and then decrease, whereas a monophasic dip was observed in Region A (Figure 12.7). Region C (Figure 12.9) appears even more complex with a triphasic rise-dip-rise temporal profile. We observe that Regions A to C are located with increasing proximity to the CSD induction point (3 mm above the imaging field).
Because fractional changes in scattering and absorption have an equal (and opposite) effect on DC reflectance (see Section 12.2.3.3), any scattering (i.e., pathlength) changes measured here could be misinterpreted as absorption events with traditional ISOI analyses (i.e., DC reflectance only). In our observations, the measured scattering change of up to −0.05 mm−1 would be interpreted as an increase in absorption of up to +0.005 mm−1, more than the maximum measured absorption change for wavelengths 730, 780, or 830 nm in any of the three regions. In order to account for differential pathlength changes, Kohl et al. proposed a multispectral model [39], which they used to differentiate dynamic scattering and absorption changes using ISOI. This approach improves ISOI accuracy, and has been generally adopted as the method of choice for quantitative functional imaging. For dynamic measurements, we see MI as an improvement over this approach as it alternatively uses frequency domain measurements at a single wavelength to derive absolute scattering and absorption coefficients. This potentially provides a simplified single-wavelength measurement apparatus for detection of scattering, and also avoids potential mis-estimation of background optical properties.
Light scattering changes induced by spreading depression have been reported previously, and a comprehensive review is provided by Somjen. With in vivo spatially resolved reflectance measurements, Kohl et al. [11] separated absorption from scattering and observed a biphasic scattering response similar to that of Region A. With simultaneous laser scattering and electrophysiological measurements, both Jarvis et al. and Tao et al. found a strong correlation between electrical and optical scattering changes [12,13,40]. Tao et al. noted spatial heterogeneity in the dynamic spreading depression (SD) waveform related to the proximity to the SD induction site, similar to our results.
Using linear spectral analysis of absorption at all four wavelengths, we calculated the time-dependent chromophore concentration for Regions A, B, and C, presented in Figure 12.10A,B,C, respectively. In each region, the calculated baseline concentrations of H2O were assumed to be constant. All three regions exhibit remarkably similar trends in HbR, HbO2, HbT, and StO2. This similarity is not clear in the DC traces of Figures 12.7–12.9, further highlighting the benefit of accurate separation of μa and μs′. Focusing on the first CSD event, there is a very consistent signature of: (1) a 2-minute latency post-KCl administration, (2) a 30-second period of decreasing StO2 (3) a dramatic spike in both StO2 (3–10%) and HbT (2–4 μM) with rise and decay times of approximately 1 minute each. For each region, the final StO2 is approximately 5–10% lower than baseline, while the HbT restores to baseline values. This process repeats again twice more, except that the phase (2) desaturation appears to be absent. Additionally, in the “vessel” Region 3, we observe a gradual increase in HbT over the 30 minutes, indicating chronic blood pooling.
FIGURE 12.10
Recovered HbR, HbO2, HbT, and STO2, for ROIs A, B, and C (top, middle, and bottom), recovered by analysis of the multispectral absorption coefficients from Figures 12.7–12.9b (top).
We show in Figure 12.11 the spatio-temporal evolution of both chromophore concentration and scattering changes from the first SD wave in rat 3. These are depicted in the form of a time derivative, i.e., (C(tn + 1) − C(tn))/(tn + 1 − tn), where C represents concentration/saturation/scattering values and tn represents time of acquisition for data point n. This visualization is appealing as it highlights the changes with high contrast [18]. From left to right, we show HbO2, HbR, HbT, StO2, and μs′. Notice the wave in scattering which propagates from top right to bottom left, at a rate of approximately 3 mm/min. An increase, or “spike” in scattering is observed initially in the top right hand corner, in close proximity to the location of KCl administration. Note the large spikes in HbT and StO2 due to vascular activity from depression wave propagation through the measurement field. We observe a transient increase in saturation and blood volume. Over the longer time periods, however, we observe a slow, sustained trend toward hypoxia in the vein regions.
FIGURE 12.11
Spatio-temporal evolution of the hemodynamic and neural scattering response during a single spontaneous CSD event in rat 3. For visualization, a time derivative of the image sequence is displayed to highlight changes.
The spatio-temporal evolution of the scattering coefficient in Figure 12.11 reveals a spatially defined scattering wave (reduction in μs′) that precedes hemodynamic changes. The scattering drop is presumed to be a consequence of neuronal depolarization accompanying CSD. This observed wave pattern has been shown previously with reflectance ISOI and attributed to blood volume changes [18]. Interestingly, the scattering depolarization wave is clearly followed in space and time by the increase in deoxyhemoglobin (HbR), decrease in saturation (StO2), and drop in oxyhemoglobin (HbO2); changes that are consistent with depolarization-induced neural tissue oxygen consumption.
12.3.3. Dynamic MI Spectroscopy of Stroke
In order to assess the sensitivity of MI to stroke, we conducted preliminary studies in a rat middle cerebral artery occlusion (MCAo) model, the most commonly involved artery in ischemic strokes. The left MCA was surgically cauterized using monopolar cautery or ligated to produce a permanent stroke. Figure 12.12 shows pre-versus post-MCAo results for a representative animal. Data were acquired at 5 wavelengt
Original Source: https://www.ncbi.nlm.nih.gov/books/NBK20233/
Sue Hale, Physical Therapist. Hand therapist in Melbourne FL. Sue speaks of her experiences using the Microlight ML830® Cold Laser in her practice and personally. Sue uses the ML830® Laser daily for treating all types of injuries; from hand injuries, back pain and injuries, runner's injuries, knee injuries, and many other conditions.
video length: (1:17)
Original Source: https://www.youtube.com/watch?v=m2kYC8DGFJ8&nohtml5=False
Django's 1st Low Level Laser Therapy (LLLT)
Django is now 13 months old and has had clicking and obvious pain in his right knee for the last 6 months. After a negative valley fever test & 2 knee x-rays showing no fracture or tumors,and being told by 2 vets, it's possibly a soft tissue (CCL/ACL) injury and that he needed a CT, MRI or arthroscopy to get a more definitive diagnosis. Django's owner decided to try LLLT to alleviate some of his pain.
video length: (0:32)
Django Post MPL Surgery Days 1-2
Django had surgery (medial imbrication, with a lateral release & anti-rotational sutures) on his left knee to correct a grade 2 medial patellar luxation August 20, 2015-. Here he is the day of surgery from check in through 48 hours later getting cold laser therapy.
video length: (1:27)
Loving Life
Here's Django approximately 9 weeks post-op, fully enjoying the newfound use of his leg.
video length: (1:41)
More videos of Django's journey can be found on his owner's Youtube channel, link below.
Original Source: https://www.youtube.com/channel/UCVCp5py29hdRoosgAJ_qIbA
The young man featured in this video had a history of cognitive issues, including difficulty with reading and comprehension.
video length: (1:54)
Original Source: https://www.youtube.com/watch?v=u5Zs3NSefa4
This video covers the operation of the LZ30 family of lasers in Basic Mode.
video length: (3:47)
This video covers the Advanced Features of the LZ30 family of lasers.
video length: (6:17)
This video covers Safety and Regulatory Considerations for the use of the LZ30 family of lasers.
video length: (3:49)
Original Source: https://www.youtube.com/watch?v=pkSYuEIxZc0&nohtml5=False
Penetration depth test between a high powered class 4 970nm laser and a low powered class 3b LLLT 810nm laser, by shining through hand.
- Class 4 Laser: 11-55mW went through hand
- Class 3b LLLT Laser: 55-90mW went through hand
Result: 810nm laser passes through tissue better than 970nm Laser
video length: (3:09)
Original Source: https://www.youtube.com/watch?v=UASgE-yO8Xk
Demonstration of LLLT on a dog with inflammation, and pain in his paw.
video length: (3:36)
Original Source: https://www.youtube.com/watch?v=Hg4ruVCNp7o&nohtml5=False
Abstract
This study investigates the influence of gallium–arsenide (GaAs) laser photobiostimulation applied with different energy densities on skin wound healing by secondary intention in rats. Three circular wounds, 10 mm in diameter, were made on the dorsolateral region of 21 Wistar rats weighting 282.12 ± 36.08 g. The animals were equally randomized into three groups: Group SAL, saline solution 0.9%; Group L3, laser GaAs 3 J/cm2; Group L30, laser GaAs 30 J/cm2. Analyses of cells, blood vessels, collagen and elastic fibres, glycosaminoglycans and wound contraction were performed on the scar tissue from different wounds every 7 days for 21 days. On day 7, 14 and 21, L3 and L30 showed higher collagen and glycosaminoglycan levels compared to SAL (P < 0.05). At day 21, elastic fibres were predominant in L3 and L30 compared to SAL (P < 0.05). Type-III collagen fibres were predominant at day 7 in both groups. There was gradual reduction in these fibres and accumulation of type-I collagen over time, especially in L3 and L30 compared with SAL. Elevated density of blood vessels was seen in L30 on days 7 and 14 compared to the other groups (P < 0.05). On these same days, there was higher tissue cellularity in L3 compared with SAL (P < 0.05). The progression of wound closure during all time points investigated was higher in the L30 group (P < 0.05). Both energy densities investigated increased the tissue cellularity, vascular density, collagen and elastic fibres, and glycosaminoglycan synthesis, with the greater benefits for wound closure being found at the density of 30 J/cm2.
Laser photobiostimulation has been used as a non-invasive alternative to treat muscle injuries and skin wounds, and to control inflammatory processes and pain (Enwemeka et al. 2004; Reddy 2004). Although the use of laser light to accelerate the healing process was documented in the literature for the first time in 1971 (Mester et al. 1971; Shields & O'Kane 1994), and the efficacy of this therapeutic modality is proven, parameters about how it is used are still controversial (Tuner & Hode 1998; Moore et al. 2005). Parameters such as the type and source of laser light emission, number of applications, duration of treatment and mechanisms of action through which the laser light exerts its effects remain the focus of investigation in the ongoing search for efficient methodologies that justify and encourage the use of laser light in clinical practice. Several mechanisms have been proposed to explain the effects of laser light on biological tissues, including the absorption of light by the enzymes of the electron transport chain in the inner mitochondrial membrane, stimulation of the production of oxygen, and cell proliferation induced by photoactivation of the calcium channels (Shields & O'Kane 1994; Breitbart et al. 1996). Recent studies show that the main cells stimulated by laser light are macrophages and fibroblasts (Gonçalves et al. 2010a; Xavier et al. 2010). Macrophages are important cells responsible for releasing growth factors that stimulate proliferation, differentiation and synthesis of extracellular matrix components (Shields & O'Kane 1994; Reddy 2004; Gonçalves et al. 2010b). In in vitro experimental models examination of a wide range of wavelengths showed that wavelengths between 524 nm and 904 nm were related to decreased time of wound healing by stimulating fibroblast and keratinocyte differentiation, collagen production and skin neovascularization (Pogrel et al. 1997; Demidova-Rice et al. 2007).
Previous studies have shown that the gallium–arsenide laser (GaAs λ 660 nm) is able to stimulate skin wound healing in humans and laboratory animals with energy densities between 1 and 4 J/cm2 (Medrado et al. 2003; Pugliese et al. 2003; Reddy 2004). However, most of the work is restricted to investigating the effect of energy densities below 4 J/cm2, and reports on the effects of high energy densities in tissue repair are scarce and inconclusive. Thus, this study was designed to investigate the influence of laser photobiostimulation applied with different energy densities in a rat model of skin wound healing by secondary intention.
Materials and methods
Animals
Twenty-one male Wistar rats (Rattus norvegicus), 10 week old and weighing 282.12 ± 36.08 g, obtained from the Biological Sciences Center, Federal University of Viçosa, Minas Gerais, Brazil, were used in this study. During the experiment, the animals were allocated to individual cages that were cleaned daily and maintained in an environment with controlled temperature (22 ± 2 °C), light (12 h light/dark cycles) and humidity (60–70%).
Ethical approval
The experiment was conducted in accordance with International Ethical Standards for the Care and Use of Laboratory Animals and approved by the Ethics Committee for the Care and Use of Laboratory Animals of the Federal University of Viçosa (UFV; registration 005/2008).
Experimental protocol
Before the surgical wounds were made, the animals were anaesthetized using intramuscular ketamine (50 mg/kg) and xylazine (20 mg/kg). Then, trichotomy was performed on the dorsolateral region of the animals, and the area was defatted using ethyl ether (Merck®, Rio de Janeiro, Brazil) followed by the use of 70% ethanol and 10% povidone–iodine for anti-sepsis (Johnson Diversey®, Rio de Janeiro, Brazil). Three circular secondary intention wounds 10 mm in diameter were made in the dorsolateral region of the animals by removing the skin with a scalpel until the exposure of the muscle fascia. The standardized wound area was marked with a dermographic pencil and checked using an analogical pachymeter (Kingtools®, São Paulo, Brazil) (Gonçalves et al. 2013). After completion of the wounds, the animals were randomly divided into three groups with seven animals in each. Group saline (SAL, control): saline solution 0.9%; Group L3: GaAs laser (λ 660 nm, 3 J/cm2); Group L30: GaAs laser (λ 660 nm, 30 J/cm2). The laser device (Endophoton®, KLD, São Paulo, Brazil), which was previously calibrated by the manufacturer, presented an output of 20 mW, power density of 25.47 mW/cm2, visible radiation and a 0.79 cm2 circular beam. Laser light was applied transcutaneously at six equidistant points around the wound margin. The wounds were irradiated for 118.5 s in L3 to release 3 J/cm2 and 1185 s in L30 to release 30 J/cm2. The wounds were cleaned daily with 0.9% saline solution immediately before the laser application. The treatments were started immediately after the wound was made once a day for 21 days corresponding to the experiment duration.
Analysis of wound contraction
The progress of wound closure was evaluated by measuring the wound area every 7 days in digitized images with the dimensions of 320 × 240 pixels (24 bits/pixel) obtained using a digital video camera (W320, Sony, Tokyo, Japan). The wound areas were calculated by computerized planimetry using the Image Pro-Plus image analysis software program, version 4.5, (Media Cybernetics®, Silver Spring, MA, USA), previously calibrated. Wound contraction index (WCI) was calculated using the following ratio: initial area of the wound (Ao) − area on the day of measurement (Ai)/initial area of the wound (Ao) × 100 (Gonçalves et al. 2013). The third wound was selected for this analysis because the tissue from this wound was collected on the final day of the experiment (21st).
Analysis of total collagen and glycosaminoglycans
For each group, 35 histological sections 8 μm thick stained with Fast green and Sirius red were used to quantify the levels of collagen and total protein in scar tissue using a previously described spectrophotometric method (López-De León & Rojkind 1985). In this method, the maximal absorbance to the Sirius red (540 nm) and Fast green (605 nm) dyes, correspond to the amount of collagen and non-collagen proteins respectively. For each section used in the collagen analysis, a corresponding serial section was obtained, which was used in the analysis of glycosaminoglycans. The tissue content of glycosaminoglycans was determined according to a modified procedure described by Corne et al. (1974). Sections were transferred immediately to 10 ml of 0.1% (w/v) Alcian blue 8GX solution (0.16 M sucrose solution buffered with 0.05 ml sodium acetate at pH 5). After successive rinses in 10 ml of 0.25 M sucrose solution, dye adhered to the tissue was extracted with 10 ml of 0.5 M magnesium chloride, and the absorbance of the resultant solution was analysed in a spectrophotometer at 580 nm.
Stereological analysis
Tissue fragments were collected from the different wounds every 7 days. Each fragment contained tissue removed from the centre of the wound and part of the uninjured adjacent tissue that had not received laser radiation. The fragments were put into Karnovsky's solution for 24 h and processed for paraffin embedding. Semiserial 4-μm-thick vertical uniform random (VUR) sections were obtained using a rotating microtome (Leica Multicut 2045®, Reichert-Jung Products, Jena, Germany). One of every 20 sections was used to avoid repeating analysis of the same histological area. Sections mounted on histology slides were stained with haematoxylin and eosin for visualization of cells and blood vessels (Karu 2003), Verhoeff's method for elastic fibres (Verhoeff 1908) and Sirius red dye (Sirius red F3B, Mobay Chemical Co., Union, NJ, USA) for marking collagen fibres observed under polarizing microscopy (Junqueira et al. 1979). Analysis of collagen was based on the birefringence properties of the collagen fibres, because under polarization, the thick collagen fibres (type I) appear in shades of bright colour ranging from red to yellow, whereas thin reticular fibres (type III) are shown in bright green (Gonçalves et al. 2010a).
The slides were visualized, and the images captured using a BX-60® light microscope (Olympus, São Paulo, Brazil) connected with a digital camera (QColor-3®, Olympus, São Paulo, Brazil). For each wound and staining method, 10 histological sections were analysed. For each section, five images were obtained randomly with a 20× objective lens, and the cells and blood vessels were quantified in the histological area. Under each image was applied an unbiased two-dimensional test area (At) of 69 × 103 μm2 at tissue level, so that the total histological area investigated was 24 × 106 μm2. The proportion of the histological area occupied by type-I and type-III collagen fibres was determined using the Quantum® software program (Department of Soil Science, Federal University of Viçosa, Viçosa, Brazil) (Gonçalves et al. 2010a).
The volume density of cells (Vv [cells], %), blood vessels (Vv [bvs], %) and elastic fibres (Vv [elf], %) was estimated as:
where ΣPp [cells; bvs; elf] denotes the total number of points on the cells, blood vessels or elastic fibres, and ΣPt is the total points of the test system (ΣPt = 200).
The length density of blood vessels (Lv [bvs], mm/mm3) and elastic fibres (Lv [elf], mm/mm3) was estimated as:
where ΣQ−[bvs] denotes the total number of blood vessel or elastic fibre profiles counted in the At, and ΣP [tissue] is the total number of points on the tissue (Brüel et al., 2005).
The surface area density of blood vessels (Sv [bvs], mm2/mm3) was estimated as:
where ΣI [bvs] denotes the total number of intersections between the cycloid arcs (here 44) and the blood vessel surface area, and l is the length of the cycloid arcs. The Image Pro-Plus 4.5® image analysis software (Media Cybernetics) was used in the stereological analysis.
Data analysis
The data were expressed as mean and standard deviation (mean ± SD). The normalcy of the data distribution was verified using the Shapiro–Wilk test. All variables investigated were subjected to the Kruskal–Wallis test for multiple comparisons. Statistical significance was established at P < 0.05. The analysis was performed using the software Sigma Stat 3.0® (Systat Software Inc., Chicago, IL, USA).
Results
There were no significant differences in total collagen and glycosaminoglycan content in the uninjured tissues from the different groups (Table 1). At all investigated time points, the groups exposed to laser photobiostimulation had higher collagen content in the scar tissue compared with SAL (P < 0.05). At day 7, the content of glycosaminoglycans was higher in both groups exposed to laser irradiation in relation to SAL group. A similar result was observed at day 14, but only the group L30 was significantly different compared with SAL. At the end of the experiment, the content of glycosaminoglycans was significantly higher in L3 compared with the other groups.
The analysis of collagen fibres in the uninjured tissue showed no difference in the proportion of type-I and type-III fibres between the groups. On days 14 and 21, the groups receiving laser irradiation had higher proportion of type-I collagen fibres compared with SAL, with the best results in L30 (P < 0.05). At day 21, this variable was similar in L3 and L30. Animals in L3 and L30 had a higher proportion of type-III fibres compared with SAL on days 7 and 14, with the best results in L3 (P < 0.05). At day 21, the content of type-III fibres was similar in all groups (Figure 1).
The analysis of elastic fibres in the uninjured tissue showed no difference in the proportion of volume and length of elastic fibres between the groups. On day 21, the groups receiving laser irradiation had a higher proportion of volume (Vv) and length (Lv) of elastic fibres (elf) compared with SAL (P < 0.05) (Figure 2).
The extent of scar tissue occupied by blood vessels is shown in Table 2. There were no significant differences in volume, length or surface densities of blood vessels in the unharmed tissues (day 0). At day 7, all these parameters were significantly higher in both groups that received laser light compared with SAL, with better results in L30 (P < 0.05). On days 14 and 21, similar results were observed in L30 compared with other groups (P < 0.05).
The results of tissue cellularity are shown in Table 3. The unharmed tissue presented similar cellularity in all groups. On days 7 and 21, the groups L3 and L30 had higher cellularity in the granulation tissue compared with SAL (P < 0.05). At day 14, there was a higher volume density of cells in L3 compared with the other groups (P < 0.05).
Figure 3 colour shows photomicrographs of skin histological sections collected in both groups investigated. The uninjured skin showed similar cellularity and blood vessel density in all groups. On days 7, 14 and 21, there was increased cell distribution in all groups, with higher cellularity in L3 and L30 compared with the SAL (Figure 3 and Table 2). On days 7 and 14, increased density of blood vessels was observed mainly in the group L30 compared with the other groups. At day 21, there was a higher density of cells and blood vessels in both groups that received laser light compared with SAL.
At all times investigated, the group L30 showed a significant reduction in the wound area compared with other groups (P < 0.05). At day 7, the rate of wound closure was higher in the groups receiving laser irradiation compared with SAL (P < 0.05). A high rate of wound closure was identified in SAL at the end of the experiment (day 21). Total closure of the wound was achieved in L30 by day 21, a feature not found in the other groups (Table 4 and Figure 4).
Discussion
The present study investigated the effect of different energy densities of the GaAs laser on skin wound healing. Using design-based stereology and spectrophotometric methods, the results indicated that the laser photobiostimulation was able to modify the morphology of the scar tissue in a time-dependent way leading to more efficient healing.
It is widely recognized that for healing to occur properly, synthesis of extracellular matrix is required, especially collagen, a protein that provides structural support for cell proliferation and neoangiogenesis (Liu et al. 2008; Gonçalves et al. 2010a,b2010b). The results of this study showed that both groups that received laser irradiation had a higher total collagen content at all time points analysed. These findings corroborate the results found by Medrado et al. (2003) and Gonçalves et al. (2010a,b2010b), which observed a significant increase in the collagen content in scar tissue 7 days after laser irradiation of skin wounds in rats. Collagen synthesis is an event directly related to the biomechanical properties of the scar tissue. In this context, the greatest collagen content gives the scar tissue greater resistance to mechanical stresses, a characteristic essential to the maintenance of tissue integrity and to reduced susceptibility to further injury (Karu 2003; Gonçalves et al. 2010a,b2010b).
Considering the different collagen types, both irradiated groups had a higher proportion of type-I and type-III collagen fibres than the control group. Both energy densities investigated were effective in stimulating the maturation of collagen in scar tissue, and the best results were found in group L30. Although laser irradiation has influenced the total levels of collagen, it is essential to identify the types of collagen produced in scar tissue. Traditionally, the assessment of type-I and type-III fibrillar collagens has provided an important indicator of the progression of the healing process (Karu 2003; Gonçalves et al. 2010a,b2010b). In the earlier stages of cutaneous wound healing the synthesis of type-III collagen predominates and is then gradually replaced by type-I collagen fibres, thicker, resilient and the type of collagen that predominate in normal tissue (unharmed). Thus, determining the proportion of type-I collagen fibres in relation to type-III fibres allows us to evaluate the level of remodelling and maturation of scar tissue, which in turn indicates how much this tissue approximates to the tissue when it is unharmed (Reddy 2004; Mendez et al. 2004; Gonçalves et al. 2010b). Considering these characteristics, it is widely recognized that therapeutic approaches that stimulate the synthesis of type-I collagen, leading to increased collagen maturation, are potentially useful strategies in the treatment of skin injuries (Medrado et al. 2003; Pugliese et al. 2003; Gonçalves et al. 2010a,b2010b).
An additional result shown in the present study was the influence of the laser photobiostimulation on the glycosaminoglycan content in irradiated tissue. This finding indicates a transient modification of some structural polysaccharides of the extracellular matrix during the healing of skin wounds. It is believed that this event is possibly related to the development of a structural and functional support able to stimulate the cell migration and differentiation (Pierce et al. 1991; Hodde 2002; Lai et al. 2006). It is known that the content and distribution of polysaccharides molecules are important to the hydration (attraction of water molecules – solvation water) and nutrition of the granulation tissue during the development of a vascular network that would allow the progression of tissue repair (Pierce et al. 1991; Hodde 2002; Lai et al. 2006). Although the quantity and quality of non-protein and protein components of the stromal tissue are important in tissue repair, currently there is not sufficient evidence as to how the laser irradiation modulates the synthesis and secretion of polysaccharide molecules to stimulate the healing of skin wounds. As the analysis of these molecules performed in this study is not as sensitive and specific as some molecular biology techniques, we cannot yet establish how much the induction of synthesis of polysaccharides contributes to the mechanism through which the laser photobiostimulation improves the healing process. Thus, further studies are needed in this area.
In addition to the increased collagen and glycosaminoglycan content, the laser-treated groups also had a higher tissue area occupied by capillaries, with the best results in the group that received the highest energy density. Furthermore, this study confirmed previous findings (Moore et al. 2005; Houreld et al. 2010) that the laser radiation, in both low and high doses, stimulates the tissue cellularity and increases the synthesis of granulation tissue, which are aspects involved in tissue repair. These data are similar to those described by Corazza et al. (2007) and Gonçalves et al. (2010a). These authors showed the efficiency of high-energy dosages in the induction of fibroblast proliferation and neoangiogenesis. However, these findings are in contrast to previous studies that show better results in these variables with the use of low doses of energy, especially 1–4 J/cm2 (Tuner & Hode 1998; Medrado et al. 2003; Reddy 2004). A complex mechanism has been described through which the laser light stimulates the tissue repair. Studies with models of soft-tissue injuries have provided evidence that the photobiostimulation laser induces the synthesis and secretion of mitogens (Posten et al. 2005; Houreld et al. 2010; Xavier et al. 2010) such as vascular endothelial growth factor (VEGF), platelet-derived growth factor (PDGF), fibroblast growth factor (FGF) and tumour necrosis factor alpha (TNF-α) by macrophages, neutrophils, endothelial cells and fibroblasts, which stimulate the reorganization and repair of damaged tissue through the induction of proliferation, cell differentiation and neoangiogenesis (Posten et al. 2005; Houreld et al. 2010; Xavier et al. 2010).
There is sufficient evidence that the synthesis and differentiation of parenchymal and stromal components of the tissue determine the progression of the reorganization of injured tissue and the quality of the neoformed tissue (Karu 2003; Posten et al. 2005; Corazza et al. 2007; Liu et al. 2008). Thus, therapeutic interventions that stimulate the production of cellular and molecular components of the granulation tissue have been effective in promoting faster closure of wounds in soft tissues (Gonçalves et al. 2010a,b2010b; Xavier et al. 2010). In the present study, the group that received a higher dose of laser radiation (L30) showed more rapid progression of wound closure compared with other groups. These data are similar to those found by Enwemeka et al. (2004) and Moore et al. (2005), which showed the influence of various parameters of laser photobiostimulation on the tissue repair, including reduction in the wound area mainly with moderate energy densities between 19 and 24 J/cm2. In contrast, in these same studies, densities below 8.25 J/cm2 did not improve the injuries' closing time, findings that are contrary to the results of Medrado et al. (2003), Pugliese et al. (2003) and Mendez et al. (2004) that demonstrated a higher closing speed of the injured tissue at low energy densities (2–4 J/cm2), while high doses led to a delay in tissue recovery.
The findings of the present study suggest that laser photobiostimulation can modulate the process of skin wound healing in a time-dependent way. The higher energy density investigated was more effective in modifying the morphology of the parenchyma and stroma of the scar tissue and led to a faster healing. Considering the findings of this study in relation to the contradictory results of previous investigations, it is evident that additional studies are required to investigate the effects of photobiostimulation lasers with different energy densities on biological tissues, especially in relation to ultrastructural and metabolic changes of injured tissues.
Intro: This study investigates the influence of gallium-arsenide (GaAs) laser photobiostimulation applied with different energy densities on skin wound healing by secondary intention in rats. Three circular wounds, 10 mm in diameter, were made on the dorsolateral region of 21 Wistar rats weighting 282.12 ± 36.08 g. The animals were equally randomized into three groups: Group SAL, saline solution 0.9%; Group L3, laser GaAs 3 J/cm(2); Group L30, laser GaAs 30 J/cm(2). Analyses of cells, blood vessels, collagen and elastic fibres, glycosaminoglycans and wound contraction were performed on the scar tissue from different wounds every 7 days for 21 days. On day 7, 14 and 21, L3 and L30 showed higher collagen and glycosaminoglycan levels compared to SAL (P < 0.05). At day 21, elastic fibres were predominant in L3 and L30 compared to SAL (P < 0.05). Type-III collagen fibres were predominant at day 7 in both groups. There was gradual reduction in these fibres and accumulation of type-I collagen over time, especially in L3 and L30 compared with SAL. Elevated density of blood vessels was seen in L30 on days 7 and 14 compared to the other groups (P < 0.05). On these same days, there was higher tissue cellularity in L3 compared with SAL (P < 0.05). The progression of wound closure during all time points investigated was higher in the L30 group (P < 0.05). Both energy densities investigated increased the tissue cellularity, vascular density, collagen and elastic fibres, and glycosaminoglycan synthesis, with the greater benefits for wound closure being found at the density of 30 J/cm(2).
Background: This study investigates the influence of gallium-arsenide (GaAs) laser photobiostimulation applied with different energy densities on skin wound healing by secondary intention in rats. Three circular wounds, 10 mm in diameter, were made on the dorsolateral region of 21 Wistar rats weighting 282.12 ± 36.08 g. The animals were equally randomized into three groups: Group SAL, saline solution 0.9%; Group L3, laser GaAs 3 J/cm(2); Group L30, laser GaAs 30 J/cm(2). Analyses of cells, blood vessels, collagen and elastic fibres, glycosaminoglycans and wound contraction were performed on the scar tissue from different wounds every 7 days for 21 days. On day 7, 14 and 21, L3 and L30 showed higher collagen and glycosaminoglycan levels compared to SAL (P < 0.05). At day 21, elastic fibres were predominant in L3 and L30 compared to SAL (P < 0.05). Type-III collagen fibres were predominant at day 7 in both groups. There was gradual reduction in these fibres and accumulation of type-I collagen over time, especially in L3 and L30 compared with SAL. Elevated density of blood vessels was seen in L30 on days 7 and 14 compared to the other groups (P < 0.05). On these same days, there was higher tissue cellularity in L3 compared with SAL (P < 0.05). The progression of wound closure during all time points investigated was higher in the L30 group (P < 0.05). Both energy densities investigated increased the tissue cellularity, vascular density, collagen and elastic fibres, and glycosaminoglycan synthesis, with the greater benefits for wound closure being found at the density of 30 J/cm(2).
Abstract: Abstract This study investigates the influence of gallium-arsenide (GaAs) laser photobiostimulation applied with different energy densities on skin wound healing by secondary intention in rats. Three circular wounds, 10 mm in diameter, were made on the dorsolateral region of 21 Wistar rats weighting 282.12 ± 36.08 g. The animals were equally randomized into three groups: Group SAL, saline solution 0.9%; Group L3, laser GaAs 3 J/cm(2); Group L30, laser GaAs 30 J/cm(2). Analyses of cells, blood vessels, collagen and elastic fibres, glycosaminoglycans and wound contraction were performed on the scar tissue from different wounds every 7 days for 21 days. On day 7, 14 and 21, L3 and L30 showed higher collagen and glycosaminoglycan levels compared to SAL (P < 0.05). At day 21, elastic fibres were predominant in L3 and L30 compared to SAL (P < 0.05). Type-III collagen fibres were predominant at day 7 in both groups. There was gradual reduction in these fibres and accumulation of type-I collagen over time, especially in L3 and L30 compared with SAL. Elevated density of blood vessels was seen in L30 on days 7 and 14 compared to the other groups (P < 0.05). On these same days, there was higher tissue cellularity in L3 compared with SAL (P < 0.05). The progression of wound closure during all time points investigated was higher in the L30 group (P < 0.05). Both energy densities investigated increased the tissue cellularity, vascular density, collagen and elastic fibres, and glycosaminoglycan synthesis, with the greater benefits for wound closure being found at the density of 30 J/cm(2).
Methods: 2013 The Authors. International Journal of Experimental Pathology © 2013 International Journal of Experimental Pathology.
Conclusions: The present study investigated the effect of different energy densities of the GaAs laser on skin wound healing. Using design-based stereology and spectrophotometric methods, the results indicated that the laser photobiostimulation was able to modify the morphology of the scar tissue in a time-dependent way leading to more efficient healing. It is widely recognized that for healing to occur properly, synthesis of extracellular matrix is required, especially collagen, a protein that provides structural support for cell proliferation and neoangiogenesis (Liu et?al. 2008; Gonçalves et?al. 2010a,b2010b). The results of this study showed that both groups that received laser irradiation had a higher total collagen content at all time points analysed. These findings corroborate the results found by Medrado et?al. (2003) and Gonçalves et?al. (2010a,b2010b), which observed a significant increase in the collagen content in scar tissue 7?days after laser irradiation of skin wounds in rats. Collagen synthesis is an event directly related to the biomechanical properties of the scar tissue. In this context, the greatest collagen content gives the scar tissue greater resistance to mechanical stresses, a characteristic essential to the maintenance of tissue integrity and to reduced susceptibility to further injury (Karu 2003; Gonçalves et?al. 2010a,b2010b). Considering the different collagen types, both irradiated groups had a higher proportion of type-I and type-III collagen fibres than the control group. Both energy densities investigated were effective in stimulating the maturation of collagen in scar tissue, and the best results were found in group L30. Although laser irradiation has influenced the total levels of collagen, it is essential to identify the types of collagen produced in scar tissue. Traditionally, the assessment of type-I and type-III fibrillar collagens has provided an important indicator of the progression of the healing process (Karu 2003; Gonçalves et?al. 2010a,b2010b). In the earlier stages of cutaneous wound healing the synthesis of type-III collagen predominates and is then gradually replaced by type-I collagen fibres, thicker, resilient and the type of collagen that predominate in normal tissue (unharmed). Thus, determining the proportion of type-I collagen fibres in relation to type-III fibres allows us to evaluate the level of remodelling and maturation of scar tissue, which in turn indicates how much this tissue approximates to the tissue when it is unharmed (Reddy 2004; Mendez et?al. 2004; Gonçalves et?al. 2010b). Considering these characteristics, it is widely recognized that therapeutic approaches that stimulate the synthesis of type-I collagen, leading to increased collagen maturation, are potentially useful strategies in the treatment of skin injuries (Medrado et?al. 2003; Pugliese et?al. 2003; Gonçalves et?al. 2010a,b2010b). An additional result shown in the present study was the influence of the laser photobiostimulation on the glycosaminoglycan content in irradiated tissue. This finding indicates a transient modification of some structural polysaccharides of the extracellular matrix during the healing of skin wounds. It is believed that this event is possibly related to the development of a structural and functional support able to stimulate the cell migration and differentiation (Pierce et?al. 1991; Hodde 2002; Lai et?al. 2006). It is known that the content and distribution of polysaccharides molecules are important to the hydration (attraction of water molecules – solvation water) and nutrition of the granulation tissue during the development of a vascular network that would allow the progression of tissue repair (Pierce et?al. 1991; Hodde 2002; Lai et?al. 2006). Although the quantity and quality of non-protein and protein components of the stromal tissue are important in tissue repair, currently there is not sufficient evidence as to how the laser irradiation modulates the synthesis and secretion of polysaccharide molecules to stimulate the healing of skin wounds. As the analysis of these molecules performed in this study is not as sensitive and specific as some molecular biology techniques, we cannot yet establish how much the induction of synthesis of polysaccharides contributes to the mechanism through which the laser photobiostimulation improves the healing process. Thus, further studies are needed in this area. In addition to the increased collagen and glycosaminoglycan content, the laser-treated groups also had a higher tissue area occupied by capillaries, with the best results in the group that received the highest energy density. Furthermore, this study confirmed previous findings (Moore et?al. 2005; Houreld et?al. 2010) that the laser radiation, in both low and high doses, stimulates the tissue cellularity and increases the synthesis of granulation tissue, which are aspects involved in tissue repair. These data are similar to those described by Corazza et?al. (2007) and Gonçalves et?al. (2010a). These authors showed the efficiency of high-energy dosages in the induction of fibroblast proliferation and neoangiogenesis. However, these findings are in contrast to previous studies that show better results in these variables with the use of low doses of energy, especially 1–4?J/cm2 (Tuner & Hode 1998; Medrado et?al. 2003; Reddy 2004). A complex mechanism has been described through which the laser light stimulates the tissue repair. Studies with models of soft-tissue injuries have provided evidence that the photobiostimulation laser induces the synthesis and secretion of mitogens (Posten et?al. 2005; Houreld et?al. 2010; Xavier et?al. 2010) such as vascular endothelial growth factor (VEGF), platelet-derived growth factor (PDGF), fibroblast growth factor (FGF) and tumour necrosis factor alpha (TNF-?) by macrophages, neutrophils, endothelial cells and fibroblasts, which stimulate the reorganization and repair of damaged tissue through the induction of proliferation, cell differentiation and neoangiogenesis (Posten et?al. 2005; Houreld et?al. 2010; Xavier et?al. 2010). There is sufficient evidence that the synthesis and differentiation of parenchymal and stromal components of the tissue determine the progression of the reorganization of injured tissue and the quality of the neoformed tissue (Karu 2003; Posten et?al. 2005; Corazza et?al. 2007; Liu et?al. 2008). Thus, therapeutic interventions that stimulate the production of cellular and molecular components of the granulation tissue have been effective in promoting faster closure of wounds in soft tissues (Gonçalves et?al. 2010a,b2010b; Xavier et?al. 2010). In the present study, the group that received a higher dose of laser radiation (L30) showed more rapid progression of wound closure compared with other groups. These data are similar to those found by Enwemeka et?al. (2004) and Moore et?al. (2005), which showed the influence of various parameters of laser photobiostimulation on the tissue repair, including reduction in the wound area mainly with moderate energy densities between 19 and 24?J/cm2. In contrast, in these same studies, densities below 8.25?J/cm2 did not improve the injuries' closing time, findings that are contrary to the results of Medrado et?al. (2003), Pugliese et?al. (2003) and Mendez et?al. (2004) that demonstrated a higher closing speed of the injured tissue at low energy densities (2–4?J/cm2), while high doses led to a delay in tissue recovery. The findings of the present study suggest that laser photobiostimulation can modulate the process of skin wound healing in a time-dependent way. The higher energy density investigated was more effective in modifying the morphology of the parenchyma and stroma of the scar tissue and led to a faster healing. Considering the findings of this study in relation to the contradictory results of previous investigations, it is evident that additional studies are required to investigate the effects of photobiostimulation lasers with different energy densities on biological tissues, especially in relation to ultrastructural and metabolic changes of injured tissues.
Original Source: http://www.ncbi.nlm.nih.gov/pubmed/24354418
Background: To evaluate the effect and safety of the 532nm Pulsed Potassium-Titanyl-Phosphate (KTP) laser in the office-based treatment of patients with Reinke's edema using objective and subjective scaled outcome measures.
Abstract: Abstract OBJECTIVES/HYPOTHESIS: To evaluate the effect and safety of the 532nm Pulsed Potassium-Titanyl-Phosphate (KTP) laser in the office-based treatment of patients with Reinke's edema using objective and subjective scaled outcome measures. STUDY DESIGN: Case Series. SETTING: Tertiary hospital center. SUBJECTS: Seven adult females undergoing in-office KTP laser treatment for Reinke's edema. METHODS: Participants were studied pre- and posttreatment. Vocal function was evaluated by objective aerodynamic and acoustic analysis. Subjective changes were evaluated using the GRBAS scale, Voice Handicap Index, and videostroboscopy. Histologic effects of the laser were investigated by comparing one patient treated with laser one year prior to excision, one treated with laser just prior to excision, and one control patient who underwent excision without prior laser treatment. RESULTS: At an average postoperative follow up of 17.8 weeks (range 5-78), maximum phonation time trended toward improvement. The median VHI score decreased from 37 to 26 (p=0.150). There was a reduction in each component of the GRBAS scoring and the median fundamental frequency increased from 162 to 186 (p=0.625). Stroboscopic findings demonstrated an intact posttreatment mucosal wave. Histologic comparison of the tissue effects of laser in three patients demonstrated changes in vocal fold vascularity but no acute or long-term damage to the overlying epithelium. CONCLUSION: Objective and subjective scaled measures suggest that treatment of Reinke's edema in the office with a 532nm KTP laser may result in improved voice. It appears safe with histologic preservation of the vocal fold vibratory epithelium and persistence of mucosal wave. Copyright © 2012 The American Laryngological, Rhinological, and Otological Society, Inc.
Methods: Case Series.
Results: Tertiary hospital center.
Conclusions: Seven adult females undergoing in-office KTP laser treatment for Reinke's edema.
Original Source: http://www.ncbi.nlm.nih.gov/pubmed/22886907
Background: Mesenchymal stromal cells (MSCs) are a promising cell candidate in tissue engineering and regenerative medicine. Their proliferative potential can be increased by low-level laser irradiation (LLLI), but the mechanisms involved remain to be clarified. With the aim of expanding the therapeutic application of LLLI to MSC therapy, in the present study we investigated the effects of 635 nm diode laser on mouse MSC proliferation and investigated the underlying cellular and molecular mechanisms, focusing the attention on the effects of laser irradiation on Notch-1 signal activation and membrane ion channel modulation. It was found that MSC proliferation was significantly enhanced after laser irradiation, as judged by time lapse videomicroscopy and EdU incorporation. This phenomenon was associated with the up-regulation and activation of Notch-1 pathway, and with increased membrane conductance through voltage-gated K(+) , BK and Kir, channels and T- and L-type Ca(2+) channels. We also showed that MSC proliferation was mainly dependent on Kir channel activity, on the basis that the cell growth and Notch-1 up-regulation were severely decreased by the pre-treatment with the channel inhibitor Ba(2+) (0.5 mM). Interestingly, the channel inhibition was also able to attenuate the stimulatory effects of diode laser on MSCs, thus providing novel evidence to expand our knowledge on the mechanisms of biostimulation after LLLI. In conclusions, our findings suggest that diode laser may be a valid approach for the preconditioning of MSCs in vitro prior cell transplantation.
Abstract: Abstract Mesenchymal stromal cells (MSCs) are a promising cell candidate in tissue engineering and regenerative medicine. Their proliferative potential can be increased by low-level laser irradiation (LLLI), but the mechanisms involved remain to be clarified. With the aim of expanding the therapeutic application of LLLI to MSC therapy, in the present study we investigated the effects of 635 nm diode laser on mouse MSC proliferation and investigated the underlying cellular and molecular mechanisms, focusing the attention on the effects of laser irradiation on Notch-1 signal activation and membrane ion channel modulation. It was found that MSC proliferation was significantly enhanced after laser irradiation, as judged by time lapse videomicroscopy and EdU incorporation. This phenomenon was associated with the up-regulation and activation of Notch-1 pathway, and with increased membrane conductance through voltage-gated K(+) , BK and Kir, channels and T- and L-type Ca(2+) channels. We also showed that MSC proliferation was mainly dependent on Kir channel activity, on the basis that the cell growth and Notch-1 up-regulation were severely decreased by the pre-treatment with the channel inhibitor Ba(2+) (0.5 mM). Interestingly, the channel inhibition was also able to attenuate the stimulatory effects of diode laser on MSCs, thus providing novel evidence to expand our knowledge on the mechanisms of biostimulation after LLLI. In conclusions, our findings suggest that diode laser may be a valid approach for the preconditioning of MSCs in vitro prior cell transplantation. Copyright © 2012 Wiley Periodicals, Inc.
Methods: Copyright © 2012 Wiley Periodicals, Inc.
Original Source: http://www.ncbi.nlm.nih.gov/pubmed/22628164
Background: The quality-switched ruby laser (QSRL) has been widely used for the treatment of pigmented lesions, but clinical evaluations in most studies have been conducted on macroscopic skin color observation comparing the laser-treated skin with its nontreated surrounding area. A few investigations examined skin changes after laser therapy at a cellular level, but almost none did so noninvasively.
Abstract: Abstract BACKGROUND: The quality-switched ruby laser (QSRL) has been widely used for the treatment of pigmented lesions, but clinical evaluations in most studies have been conducted on macroscopic skin color observation comparing the laser-treated skin with its nontreated surrounding area. A few investigations examined skin changes after laser therapy at a cellular level, but almost none did so noninvasively. OBJECTIVE: To elucidate the dynamic changes after QSRL irradiation of facial solar lentigo using noninvasive optical techniques. MATERIALS AND METHODS: Time-sequential imaging of Japanese female patients with a clinical diagnosis of solar lentigo was performed using ultraviolet photography, high-magnification videomicroscopy, and reflectance-mode confocal microscopy to examine pigmentary change after QSRL irradiation. RESULTS: The present study showed that remaining melanocytes were visible in the solar lentigo of all subjects when crusts peeled off, despite hardly observable skin pigmentation to the naked eye. Moreover, noninvasive confocal imaging revealed that pigmented melanocytes varied in each solar lentigo after QSRL treatment, as indicated by melanin reflection level. CONCLUSIONS: Optical techniques facilitate the evaluation of the in vivo dynamics of epidermal-melanocytic changes in solar lentigo after QSRL therapy and may be useful for monitoring outcomes after laser irradiation.
Methods: To elucidate the dynamic changes after QSRL irradiation of facial solar lentigo using noninvasive optical techniques.
Results: Time-sequential imaging of Japanese female patients with a clinical diagnosis of solar lentigo was performed using ultraviolet photography, high-magnification videomicroscopy, and reflectance-mode confocal microscopy to examine pigmentary change after QSRL irradiation.
Conclusions: The present study showed that remaining melanocytes were visible in the solar lentigo of all subjects when crusts peeled off, despite hardly observable skin pigmentation to the naked eye. Moreover, noninvasive confocal imaging revealed that pigmented melanocytes varied in each solar lentigo after QSRL treatment, as indicated by melanin reflection level.
Original Source: http://www.ncbi.nlm.nih.gov/pubmed/20653729
Background: Striae distensae are a frequent skin condition for which treatment remains a challenge.
Abstract: Abstract BACKGROUND: Striae distensae are a frequent skin condition for which treatment remains a challenge. OBJECTIVES: To determine the efficacy and safety of a TriPollar radiofrequency (RF) device for the treatment of striae in skin phototypes IV-V. METHODS: Seventeen females with striae received six weekly treatments with a TriPollar RF device. The participants were evaluated using standardized photographs and a UVA-light video camera at baseline, and at 1 and 6 weeks after the final treatment. Side effects of treatment were recorded at every session. RESULTS: At 1 week after the final treatment, 38.2% and 11.8% of the subjects were assessed to have 25-50% and 51-75% improvement of their striae, respectively. Compared with the 1-week follow-up, at the 6-week follow-up a higher percentage of the subjects were rated to have improvement of their striae. There were no significant differences in the striae surface smoothness at the 1- (p = 0.907) and 6-week (p = 0.057) follow-ups, compared with that of baseline. Twelve percent (2/17), 23% (4/17), and 65% (11/17) of the study subjects rated their satisfaction of the overall improvement as slightly satisfied, satisfied, and very satisfied, respectively. No adverse effect was reported. CONCLUSION: TriPollar RF appears to be a promising alternative for the treatment of striae distensae.
Methods: To determine the efficacy and safety of a TriPollar radiofrequency (RF) device for the treatment of striae in skin phototypes IV-V.
Results: Seventeen females with striae received six weekly treatments with a TriPollar RF device. The participants were evaluated using standardized photographs and a UVA-light video camera at baseline, and at 1 and 6 weeks after the final treatment. Side effects of treatment were recorded at every session.
Conclusions: At 1 week after the final treatment, 38.2% and 11.8% of the subjects were assessed to have 25-50% and 51-75% improvement of their striae, respectively. Compared with the 1-week follow-up, at the 6-week follow-up a higher percentage of the subjects were rated to have improvement of their striae. There were no significant differences in the striae surface smoothness at the 1- (p = 0.907) and 6-week (p = 0.057) follow-ups, compared with that of baseline. Twelve percent (2/17), 23% (4/17), and 65% (11/17) of the study subjects rated their satisfaction of the overall improvement as slightly satisfied, satisfied, and very satisfied, respectively. No adverse effect was reported.
Original Source: http://www.ncbi.nlm.nih.gov/pubmed/19954393
Background: Low-level laser therapy (LLLT) is a new therapy for the treatment of hair loss. It has received enormous media attention and tremendous marketing budgets from companies that sell the devices, but no independent, peer-reviewed studies have demonstrated its efficacy in this application. Here we investigate the efficacy of LLLT in enhancing hair growth.
Abstract: Abstract BACKGROUND AND OBJECTIVE: Low-level laser therapy (LLLT) is a new therapy for the treatment of hair loss. It has received enormous media attention and tremendous marketing budgets from companies that sell the devices, but no independent, peer-reviewed studies have demonstrated its efficacy in this application. Here we investigate the efficacy of LLLT in enhancing hair growth. METHODS: A total of seven patients were exposed to LLLT twice weekly for 20 minutes each time over a period of 3-6 months. Five patients were treated for a total of 3 months and two were treated for 6 months. Videomicroscopic images were taken at baseline, 3 months, and 6 months, and analyzed for changes in vellus hair counts, terminal hair counts, and shaft diameter. Both videomicroscopic and global images underwent blinded review for evidence of subjective improvement. Patients also answered questionnaires assessing hair growth throughout the study. Neither patients nor physicians conducting the study received any financial compensation. RESULTS: The results indicate that on average patients had a decrease in the number of vellus hairs, an increase in the number of terminal hairs, and an increase in shaft diameter. However, paired i-testing indicated that none of these changes was statistically significant. Also, blinded evaluation of global images did not support an improvement in hair density or caliber. CONCLUSIONS: LLLT may be a promising treatment option for patients who do not respond to either finasteride or minoxidil, and who do not want to undergo hair transplantation. This technology appears to work better for some people than for others. Factors predicting who will most benefit are yet to be determined. Larger, longer-term placebo-controlled studies are needed to confirm these findings, and demonstrate statistical significance, or refute them altogether.
Methods: A total of seven patients were exposed to LLLT twice weekly for 20 minutes each time over a period of 3-6 months. Five patients were treated for a total of 3 months and two were treated for 6 months. Videomicroscopic images were taken at baseline, 3 months, and 6 months, and analyzed for changes in vellus hair counts, terminal hair counts, and shaft diameter. Both videomicroscopic and global images underwent blinded review for evidence of subjective improvement. Patients also answered questionnaires assessing hair growth throughout the study. Neither patients nor physicians conducting the study received any financial compensation.
Results: The results indicate that on average patients had a decrease in the number of vellus hairs, an increase in the number of terminal hairs, and an increase in shaft diameter. However, paired i-testing indicated that none of these changes was statistically significant. Also, blinded evaluation of global images did not support an improvement in hair density or caliber.
Conclusions: LLLT may be a promising treatment option for patients who do not respond to either finasteride or minoxidil, and who do not want to undergo hair transplantation. This technology appears to work better for some people than for others. Factors predicting who will most benefit are yet to be determined. Larger, longer-term placebo-controlled studies are needed to confirm these findings, and demonstrate statistical significance, or refute them altogether.
Original Source: http://www.ncbi.nlm.nih.gov/pubmed/19466643
Background: Best evidence synthesis.
Abstract: Abstract STUDY DESIGN: Best evidence synthesis. OBJECTIVE: To identify, critically appraise, and synthesize literature from 1980 through 2006 on noninvasive interventions for neck pain and its associated disorders. SUMMARY OF BACKGROUND DATA: No comprehensive systematic literature reviews have been published on interventions for neck pain and its associated disorders in the past decade. METHODS: We systematically searched Medline and screened for relevance literature published from 1980 through 2006 on the use, effectiveness, and safety of noninvasive interventions for neck pain and associated disorders. Consensus decisions were made about the scientific merit of each article; those judged to have adequate internal validity were included in our best evidence synthesis. RESULTS: Of the 359 invasive and noninvasive intervention articles deemed relevant, 170 (47%) were accepted as scientifically admissible, and 139 of these related to noninvasive interventions (including health care utilization, costs, and safety). For whiplash-associated disorders, there is evidence that educational videos, mobilization, and exercises appear more beneficial than usual care or physical modalities. For other neck pain, the evidence suggests that manual and supervised exercise interventions, low-level laser therapy, and perhaps acupuncture are more effective than no treatment, sham, or alternative interventions; however, none of the active treatments was clearly superior to any other in either the short- or long-term. For both whiplash-associated disorders and other neck pain without radicular symptoms, interventions that focused on regaining function as soon as possible are relatively more effective than interventions that do not have such a focus. CONCLUSION: Our best evidence synthesis suggests that therapies involving manual therapy and exercise are more effective than alternative strategies for patients with neck pain; this was also true of therapies which include educational interventions addressing self-efficacy. Future efforts should focus on the study of noninvasive interventions for patients with radicular symptoms and on the design and evaluation of neck pain prevention strategies.
Methods: To identify, critically appraise, and synthesize literature from 1980 through 2006 on noninvasive interventions for neck pain and its associated disorders.
Results: No comprehensive systematic literature reviews have been published on interventions for neck pain and its associated disorders in the past decade.
Conclusions: We systematically searched Medline and screened for relevance literature published from 1980 through 2006 on the use, effectiveness, and safety of noninvasive interventions for neck pain and associated disorders. Consensus decisions were made about the scientific merit of each article; those judged to have adequate internal validity were included in our best evidence synthesis.
Original Source: http://www.ncbi.nlm.nih.gov/pubmed/19251061
Demonstration of LLLT being used on a patient with a sports injury.
video length: (6:57)
Original Source: https://www.youtube.com/watch?v=mcZwYjAt7Jk
Background: The exact mechanism of the ablation of tooth hard tissue with most common wavelengths, which are 2,940 nm and 2,780 nm, is not yet clear. There are several different theories, but none of them has yet been established. Concepts and methods of looking at these mechanisms have been based on heat formation and transformation, and mathematical calculations evaluating the outcome of ablation, such as looking at the shape of cuts. This study provides a new concept, which is the monitoring of the direct interactions between laser light, water and enamel, with a high-speed camera. For this purpose, both the above-mentioned wavelengths were examined. Bovine anterior teeth were prepared as thin slices. Each imaged slice had a thickness close to that of the beam diameter so that the ablation effect could be shown in two dimensional pictures. The single images were extracted from the video-clips and then were animated. The following steps, explaining the ablation procedures during each pulse, were seen and reported: (1) low-output energy intensity in the first pulses that did not lead to an ablative effect; (2) bubble formation with higher output energy density; (3) the tooth surface during the pulse was covered with the plume of vapour (comparable with a cloud), and the margins of ablation on the tooth were not clear; (4) when the vapour bubble (cloud) was collapsing, an additional ablative process at the surface could be seen.
Abstract: Abstract The exact mechanism of the ablation of tooth hard tissue with most common wavelengths, which are 2,940 nm and 2,780 nm, is not yet clear. There are several different theories, but none of them has yet been established. Concepts and methods of looking at these mechanisms have been based on heat formation and transformation, and mathematical calculations evaluating the outcome of ablation, such as looking at the shape of cuts. This study provides a new concept, which is the monitoring of the direct interactions between laser light, water and enamel, with a high-speed camera. For this purpose, both the above-mentioned wavelengths were examined. Bovine anterior teeth were prepared as thin slices. Each imaged slice had a thickness close to that of the beam diameter so that the ablation effect could be shown in two dimensional pictures. The single images were extracted from the video-clips and then were animated. The following steps, explaining the ablation procedures during each pulse, were seen and reported: (1) low-output energy intensity in the first pulses that did not lead to an ablative effect; (2) bubble formation with higher output energy density; (3) the tooth surface during the pulse was covered with the plume of vapour (comparable with a cloud), and the margins of ablation on the tooth were not clear; (4) when the vapour bubble (cloud) was collapsing, an additional ablative process at the surface could be seen.
Original Source: http://www.ncbi.nlm.nih.gov/pubmed/18654826
Background: Best evidence synthesis.
Abstract: Abstract STUDY DESIGN: Best evidence synthesis. OBJECTIVE: To identify, critically appraise, and synthesize literature from 1980 through 2006 on noninvasive interventions for neck pain and its associated disorders. SUMMARY OF BACKGROUND DATA: No comprehensive systematic literature reviews have been published on interventions for neck pain and its associated disorders in the past decade. METHODS: We systematically searched Medline and screened for relevance literature published from 1980 through 2006 on the use, effectiveness, and safety of noninvasive interventions for neck pain and associated disorders. Consensus decisions were made about the scientific merit of each article; those judged to have adequate internal validity were included in our best evidence synthesis. RESULTS: Of the 359 invasive and noninvasive intervention articles deemed relevant, 170 (47%) were accepted as scientifically admissible, and 139 of these related to noninvasive interventions (including health care utilization, costs, and safety). For whiplash-associated disorders, there is evidence that educational videos, mobilization, and exercises appear more beneficial than usual care or physical modalities. For other neck pain, the evidence suggests that manual and supervised exercise interventions, low-level laser therapy, and perhaps acupuncture are more effective than no treatment, sham, or alternative interventions; however, none of the active treatments was clearly superior to any other in either the short- or long-term. For both whiplash-associated disorders and other neck pain without radicular symptoms, interventions that focused on regaining function as soon as possible are relatively more effective than interventions that do not have such a focus. CONCLUSION: Our best evidence synthesis suggests that therapies involving manual therapy and exercise are more effective than alternative strategies for patients with neck pain; this was also true of therapies which include educational interventions addressing self-efficacy. Future efforts should focus on the study of noninvasive interventions for patients with radicular symptoms and on the design and evaluation of neck pain prevention strategies.
Methods: To identify, critically appraise, and synthesize literature from 1980 through 2006 on noninvasive interventions for neck pain and its associated disorders.
Results: No comprehensive systematic literature reviews have been published on interventions for neck pain and its associated disorders in the past decade.
Conclusions: We systematically searched Medline and screened for relevance literature published from 1980 through 2006 on the use, effectiveness, and safety of noninvasive interventions for neck pain and associated disorders. Consensus decisions were made about the scientific merit of each article; those judged to have adequate internal validity were included in our best evidence synthesis.
Original Source: http://www.ncbi.nlm.nih.gov/pubmed/18204386
Background: In a recent case study, the use of a suction device to aid in port wine stain (PWS) laser treatments showed favorable results. It is our objective to further understand the mechanisms of vacuum-assisted laser therapy by analyzing the mechanical and optical changes of the skin and musculoskeletal tissues during the application of mild vacuum pressure from a suction cup.
Abstract: Abstract BACKGROUND AND OBJECTIVES: In a recent case study, the use of a suction device to aid in port wine stain (PWS) laser treatments showed favorable results. It is our objective to further understand the mechanisms of vacuum-assisted laser therapy by analyzing the mechanical and optical changes of the skin and musculoskeletal tissues during the application of mild vacuum pressure from a suction cup. STUDY DESIGN/MATERIALS AND METHODS: A mathematical model of tissue deformation was used to determine the changes in tissue morphology that affect the underlying laser-tissue interactions, such as epidermal stretching and thinning, blood vessel dilation, and change in blood vessel depth. Video imaging experiments were used to verify the bulk tissue deformation and skin surface stretching computed by the mathematical model. Additionally, visible reflectance spectroscopy was used to determine the changes in the optical characteristics of tissue, including blood vessel dilation and epidermal absorption coefficient. RESULTS: At a vacuum pressure of 50 kP(a), the epidermis at the center of the suction cup was measured to stretch 4% and was calculated to be thinned approximately 6%. Blood vessels embedded in the dermis were measured to dilate up to two times their original size. However, these vessels were calculated to be displaced toward the skin surface by a very small amount, approximately 1-3 microm. The absorption coefficient of the epidermis was also measured to be reduced significantly by approximately 25% at a wavelength of 585 nm. CONCLUSIONS: Mild vacuum pressure applied to the skin surface causes considerable changes in the morphology and optical properties of the tissue. These changes may be used for more efficient photothermolysis of small PWS blood vessels. (c) 2007 Wiley-Liss, Inc.
Methods: A mathematical model of tissue deformation was used to determine the changes in tissue morphology that affect the underlying laser-tissue interactions, such as epidermal stretching and thinning, blood vessel dilation, and change in blood vessel depth. Video imaging experiments were used to verify the bulk tissue deformation and skin surface stretching computed by the mathematical model. Additionally, visible reflectance spectroscopy was used to determine the changes in the optical characteristics of tissue, including blood vessel dilation and epidermal absorption coefficient.
Results: At a vacuum pressure of 50 kP(a), the epidermis at the center of the suction cup was measured to stretch 4% and was calculated to be thinned approximately 6%. Blood vessels embedded in the dermis were measured to dilate up to two times their original size. However, these vessels were calculated to be displaced toward the skin surface by a very small amount, approximately 1-3 microm. The absorption coefficient of the epidermis was also measured to be reduced significantly by approximately 25% at a wavelength of 585 nm.
Conclusions: Mild vacuum pressure applied to the skin surface causes considerable changes in the morphology and optical properties of the tissue. These changes may be used for more efficient photothermolysis of small PWS blood vessels.
Original Source: http://www.ncbi.nlm.nih.gov/pubmed/17311268
Background: The purpose of this study was to provide an account of the 5-year experience we have gained using holmium:yttrium-aluminium-garnet (Ho:YAG) lasertripsy in the treatment of ureteral stones. One-hundred thirty-seven transurethral ureterolithotripsies were performed in 131 patients. A Ho:YAG laser device, fibres with diameters of 360 and 550 mum, a video camera as well as semi-rigid and flexible ureterorenoscopes were used. Results showed that the direct success rates-which meant stone-free ureters on the first post-operative day-in the upper, middle and lower ureters were 84.6, 88.7 and 94.8%, respectively. The final success rates--which meant stone-free ureters 4 weeks after the operation without a second intervention--were 84.6, 96.7 and 96.7%, respectively. The pulsatile Ho:YAG laser beam fragmented all kinds of stones easily. No ureteral stricture or reflux was identified during the follow-up period. The advantages of Ho lasertripsy outweighed its disadvantages. Based on our experience, the Ho:YAG laser is one of the most effective and safest energy sources in the treatment of ureteral calculi.
Abstract: Abstract The purpose of this study was to provide an account of the 5-year experience we have gained using holmium:yttrium-aluminium-garnet (Ho:YAG) lasertripsy in the treatment of ureteral stones. One-hundred thirty-seven transurethral ureterolithotripsies were performed in 131 patients. A Ho:YAG laser device, fibres with diameters of 360 and 550 mum, a video camera as well as semi-rigid and flexible ureterorenoscopes were used. Results showed that the direct success rates-which meant stone-free ureters on the first post-operative day-in the upper, middle and lower ureters were 84.6, 88.7 and 94.8%, respectively. The final success rates--which meant stone-free ureters 4 weeks after the operation without a second intervention--were 84.6, 96.7 and 96.7%, respectively. The pulsatile Ho:YAG laser beam fragmented all kinds of stones easily. No ureteral stricture or reflux was identified during the follow-up period. The advantages of Ho lasertripsy outweighed its disadvantages. Based on our experience, the Ho:YAG laser is one of the most effective and safest energy sources in the treatment of ureteral calculi.
Original Source: http://www.ncbi.nlm.nih.gov/pubmed/16897107
Background: This study was conducted to analyze the effect of different irradiances of low-level laser therapy (LLLT) on angiogenesis after partial rupture of Achilles tendon of rats.
Abstract: Abstract OBJECTIVE: This study was conducted to analyze the effect of different irradiances of low-level laser therapy (LLLT) on angiogenesis after partial rupture of Achilles tendon of rats. BACKGROUND DATA: METHODS: Ninety-six animals were divided into three groups subject to treatment during 3, 5, and 7 days post-lesion. Thirty-two animals were used in each group. The groups were further divided into four subgroups with eight animals in each, receiving In-Ga-Al-P laser (660 nm) treatment at (1) mean output of 10 mW, (2) 40 mW during 10 sec, (3) a sham subgroup, and (4) a non-treatment subgroup. Each animal was subjected to a lesion of the Achilles tendon by dropping a 186-g weight from a 20-cm height over the tendon. Treatment was initiated 6 h post-injury for all the groups. Blood vessels were colored with India ink injection and were examined in a video microscope. RESULTS: Laser exposure promoted an increase in blood vessel count when compared to controls. The 40-mW group showed early neovascularization, with the greatest number of microvessels after three laser applications. The 10-mW subgroup showed angiogenesis activity around the same time as the sham laser group did, but the net number of vessels was significantly higher in the former than in the controls. After seven irradiations, the subgroup receiving 40 mW experienced a drop in microvessel number, but it was still higher than in the control groups. CONCLUSIONS: LLLT of different intensities seems to promote neovascularization in damaged Achilles tendons of rats after partial rupture compared to controls.
Results: Ninety-six animals were divided into three groups subject to treatment during 3, 5, and 7 days post-lesion. Thirty-two animals were used in each group. The groups were further divided into four subgroups with eight animals in each, receiving In-Ga-Al-P laser (660 nm) treatment at (1) mean output of 10 mW, (2) 40 mW during 10 sec, (3) a sham subgroup, and (4) a non-treatment subgroup. Each animal was subjected to a lesion of the Achilles tendon by dropping a 186-g weight from a 20-cm height over the tendon. Treatment was initiated 6 h post-injury for all the groups. Blood vessels were colored with India ink injection and were examined in a video microscope.
Conclusions: Laser exposure promoted an increase in blood vessel count when compared to controls. The 40-mW group showed early neovascularization, with the greatest number of microvessels after three laser applications. The 10-mW subgroup showed angiogenesis activity around the same time as the sham laser group did, but the net number of vessels was significantly higher in the former than in the controls. After seven irradiations, the subgroup receiving 40 mW experienced a drop in microvessel number, but it was still higher than in the control groups.
Original Source: http://www.ncbi.nlm.nih.gov/pubmed/16262576
Background: Clinical results have demonstrated that dark purple port wine stain (PWS) birthmarks respond favorably to laser induced photothermolysis after the first three to five treatments. Nevertheless, complete blanching is rarely achieved and the lesions stabilize at a red-pink color. In a feasibility study (Part I), we showed that local hypobaric pressure on PWS human skin prior to laser irradiation induced significant lesion blanching. The objective of the present study (Part II) is to investigate the effects of hypobaric pressures on the efficiency of cryogen spray cooling (CSC), a technique that assists laser therapy of PWS and other dermatoses.
Abstract: Abstract BACKGROUND AND OBJECTIVES: Clinical results have demonstrated that dark purple port wine stain (PWS) birthmarks respond favorably to laser induced photothermolysis after the first three to five treatments. Nevertheless, complete blanching is rarely achieved and the lesions stabilize at a red-pink color. In a feasibility study (Part I), we showed that local hypobaric pressure on PWS human skin prior to laser irradiation induced significant lesion blanching. The objective of the present study (Part II) is to investigate the effects of hypobaric pressures on the efficiency of cryogen spray cooling (CSC), a technique that assists laser therapy of PWS and other dermatoses. STUDY DESIGN/MATERIALS AND METHODS: Experiments were carried out within a suction cup and vacuum chamber to study the effect of hypobaric pressure on the: (1) interaction of cryogen sprays with human skin; (2) spray atomization; and (3) thermal response of a model skin phantom. A high-speed camera was used to acquire digital images of spray impingement on in vivo human skin and spray cones generated at different hypobaric pressures. Subsequently, liquid cryogen was sprayed onto a skin phantom at atmospheric and 17, 34, 51, and 68 kPa (5, 10, 15, and 20 in Hg) hypobaric pressures. A fast-response temperature sensor measured sub-surface phantom temperature as a function of time. Measurements were used to solve an inverse heat conduction problem to calculate surface temperatures, heat flux, and overall heat extraction at the skin phantom surface. RESULTS: Under hypobaric pressures, cryogen spurts did not produce skin indentation and only minimal frost formation. Sprays also showed shorter jet lengths and better atomization. Lower minimum surface temperatures and higher overall heat extraction from skin phantoms were reached. CONCLUSIONS: The combined effects of hypobaric pressure result in more efficient cryogen evaporation that enhances heat extraction and, therefore, improves the epidermal protection provided by CSC. (c) 2005 Wiley-Liss, Inc.
Methods: Experiments were carried out within a suction cup and vacuum chamber to study the effect of hypobaric pressure on the: (1) interaction of cryogen sprays with human skin; (2) spray atomization; and (3) thermal response of a model skin phantom. A high-speed camera was used to acquire digital images of spray impingement on in vivo human skin and spray cones generated at different hypobaric pressures. Subsequently, liquid cryogen was sprayed onto a skin phantom at atmospheric and 17, 34, 51, and 68 kPa (5, 10, 15, and 20 in Hg) hypobaric pressures. A fast-response temperature sensor measured sub-surface phantom temperature as a function of time. Measurements were used to solve an inverse heat conduction problem to calculate surface temperatures, heat flux, and overall heat extraction at the skin phantom surface.
Results: Under hypobaric pressures, cryogen spurts did not produce skin indentation and only minimal frost formation. Sprays also showed shorter jet lengths and better atomization. Lower minimum surface temperatures and higher overall heat extraction from skin phantoms were reached.
Conclusions: The combined effects of hypobaric pressure result in more efficient cryogen evaporation that enhances heat extraction and, therefore, improves the epidermal protection provided by CSC.
Original Source: http://www.ncbi.nlm.nih.gov/pubmed/15704166
Background: The degree of port wine stain (PWS) blanching following pulsed dye laser (PDL) therapy remains variable and unpredictable. Because of the limitations of current PDL therapy, alternative treatment approaches should be explored. The objective was to evaluate a novel methodology for selective vascular damage, combined photodynamic (PDT) and photothermal (PDL) treatment, using the in vivo chick chorioallantoic membrane (CAM) model.
Abstract: Abstract BACKGROUND AND OBJECTIVES: The degree of port wine stain (PWS) blanching following pulsed dye laser (PDL) therapy remains variable and unpredictable. Because of the limitations of current PDL therapy, alternative treatment approaches should be explored. The objective was to evaluate a novel methodology for selective vascular damage, combined photodynamic (PDT) and photothermal (PDL) treatment, using the in vivo chick chorioallantoic membrane (CAM) model. STUDY DESIGN/MATERIALS AND METHODS: Thirty microliters of benzoporphyrin derivative monoacid ring A (BPD) solution was administered intraperitoneally into chick embryos at day 12 of development. Study groups were: (1) control (no BPD, no light); (2) BPD alone; (3) continuous wave irradiation (CW) alone (576 nm, 60 mW/cm2, 125 seconds); (4) CW + PDL; (5) BPD+PDL; (6) PDT (BPD+CW); (7) PDL alone (585 nm, 4 J/cm(2)); and (8) PDT+PDL (BPD + CW followed immediately by PDL). Vessels were videotaped prior to, and at 1 hour post-intervention and then assessed for damage based on the following scale: 0, no damage; 1, coagulation; 1.5, vasoconstriction; 2.0, coagulation+vasoconstriction; 2.5, angiostasis; 3.0, hemorrhage. Damage scores were weighted by vessel "order." RESULTS: PDT + PDL resulted in significantly (P < 0.01) more severe vascular damage than was observed in any other study group: 127% more than PDT, 47% more than PDL alone. CONCLUSIONS: PDT + PDL is a novel and promising approach for selective vascular damage and may offer a more effective method for treatment of PWS and other vascular skin lesions. Copyright 2004 Wiley-Liss, Inc.
Methods: Thirty microliters of benzoporphyrin derivative monoacid ring A (BPD) solution was administered intraperitoneally into chick embryos at day 12 of development. Study groups were: (1) control (no BPD, no light); (2) BPD alone; (3) continuous wave irradiation (CW) alone (576 nm, 60 mW/cm2, 125 seconds); (4) CW + PDL; (5) BPD+PDL; (6) PDT (BPD+CW); (7) PDL alone (585 nm, 4 J/cm(2)); and (8) PDT+PDL (BPD + CW followed immediately by PDL). Vessels were videotaped prior to, and at 1 hour post-intervention and then assessed for damage based on the following scale: 0, no damage; 1, coagulation; 1.5, vasoconstriction; 2.0, coagulation+vasoconstriction; 2.5, angiostasis; 3.0, hemorrhage. Damage scores were weighted by vessel "order."
Results: PDT + PDL resulted in significantly (P < 0.01) more severe vascular damage than was observed in any other study group: 127% more than PDT, 47% more than PDL alone.
Conclusions: PDT + PDL is a novel and promising approach for selective vascular damage and may offer a more effective method for treatment of PWS and other vascular skin lesions.
Original Source: http://www.ncbi.nlm.nih.gov/pubmed/15216534
Background: Amplification of the Her-2/neu gene is accompanied by overexpression of its cell surface receptor product, c-erbB-2 protein. To investigate the degree of intratumoural heterogeneity we applied immunohistochemistry in primary Barrett's adenocarcinoma (BCA) (n = 6) and dysplasia adjacent to the carcinoma (n = 4). In addition, fluorescence in situ hybridisation (FISH) was performed in primary BCA (n = 5) and dysplastic areas (n = 4). For an objective evaluation digital image analysis and laser scanning microscopy were used. Five of six BCA showed a marked intratumoral heterogeneous staining pattern ranging from areas in which the tumour cells were negative or faintly positive to tumour areas with a strong staining of the entire membrane. Among the two dysplastic areas also a heterogeneous staining pattern was observed. FISH analysis revealed marked heterogeneity of intratumoral gene copy number changes in all BCA showing populations with different fractions of cells with polysomy, low level amplification and high level amplification. One dysplasia showed a minor population with Her-2/neu signal clusters. In conclusion, we observed marked intratumoural heterogeneity of c-erbB-2 protein overexpression and Her-2/neu gene copy number in the majority of the primary BCA analyzed. Digital image analysis and laser scanning microscopy were helpful in quantifying the variations in protein expression and DNA copy number in individual tumour cells. The observed heterogeneity could hamper the exact diagnostic determination of the c-erbB-2 status in small biopsies and possibly influence the effectiveness of a potential c-erbB-2 targeting therapy. Figures on http://www.esacp.org/acp/2000/20-1/walch.htm+ ++.
Abstract: Abstract Amplification of the Her-2/neu gene is accompanied by overexpression of its cell surface receptor product, c-erbB-2 protein. To investigate the degree of intratumoural heterogeneity we applied immunohistochemistry in primary Barrett's adenocarcinoma (BCA) (n = 6) and dysplasia adjacent to the carcinoma (n = 4). In addition, fluorescence in situ hybridisation (FISH) was performed in primary BCA (n = 5) and dysplastic areas (n = 4). For an objective evaluation digital image analysis and laser scanning microscopy were used. Five of six BCA showed a marked intratumoral heterogeneous staining pattern ranging from areas in which the tumour cells were negative or faintly positive to tumour areas with a strong staining of the entire membrane. Among the two dysplastic areas also a heterogeneous staining pattern was observed. FISH analysis revealed marked heterogeneity of intratumoral gene copy number changes in all BCA showing populations with different fractions of cells with polysomy, low level amplification and high level amplification. One dysplasia showed a minor population with Her-2/neu signal clusters. In conclusion, we observed marked intratumoural heterogeneity of c-erbB-2 protein overexpression and Her-2/neu gene copy number in the majority of the primary BCA analyzed. Digital image analysis and laser scanning microscopy were helpful in quantifying the variations in protein expression and DNA copy number in individual tumour cells. The observed heterogeneity could hamper the exact diagnostic determination of the c-erbB-2 status in small biopsies and possibly influence the effectiveness of a potential c-erbB-2 targeting therapy. Figures on http://www.esacp.org/acp/2000/20-1/walch.htm+ ++.
Original Source: http://www.ncbi.nlm.nih.gov/pubmed/11007435
This video gives a short description of how LLLT works, and shows the most basic procedure for using a laser for therapy. It also explains some of the differences between differnt types of lasers, and talks about penetratin depth.
video length: (2:22)
Original Source: https://www.youtube.com/watch?v=uqBSBs-Vvqc
This is a compilation of news reports from the early 2000's about LLLT being used in a Canadian clinic primarily for atheletes.
video length: (13:47)
Original Source: https://www.youtube.com/watch?v=-cFNMak6hOA
Therapist discuses the basics of LLLT while giving a basic demonstration of LLLT.
video length: (1:56)
Original Source: https://www.youtube.com/watch?v=goYk_I4gxaI
LLLT used on sports injury.
video length: (0:41)
Original Source: https://www.youtube.com/watch?v=z7OSDnANwqA
Dentist describes his experience using LLLT on patients.
video length: (3:57)
Original Source: https://www.youtube.com/watch?v=pqhzwEWLMTA
2 IA steroid injections + Hyaluronic Acid, systemic NSAID's, and chiropractic were administered, and joint support supplement was added to Rio's feed - with no improvement noted. Laser therapy was tried as a last resort prior to euthanasia. 15,000 total Joules were applied to Rio's left elbow and left shoulder. Over a year and a half later Rio is going strong
video length: (2:55)
Original Source: https://www.youtube.com/watch?v=_3Sneef0fe0&nohtml5=False
Informational video on LLLT, that turns into an ad at around (2:45) for terraquant.
video length: (7:06)
Original Source: https://www.youtube.com/watch?v=mvSOxHJNFXw&nohtml5=False
See a flexor withdrawal reflex cold laser therapy demonstration for chiropractic care in this free health care video.
video length: (4:28)
Original Source: https://www.youtube.com/watch?v=nHjlyLHd03w&nohtml5=False
LLLT works by using light to stimulate, regulate and accelerate cell function in the area being treated in order to heal, restore and improve damaged tissue.
LLLT can be treated on any part of the body and restores injured tissue to return to a normal level in both structure and function, which alleviates symptoms that include swelling, redness, damaged skin, and pain.
video length: (1:47)
Original Source: https://www.youtube.com/watch?v=x6I0DGHTKaQ&nohtml5=False
This video gives a simple description of LLLT, however the laser is used through clothing for demo purposes this would not be the case in actual LLLT.
video length: (2:22)
Original Source: https://www.youtube.com/watch?v=MD9-M-cN0_I&nohtml5=False
Two videos of a tiger recieving LLLT on a wound and on it's eye, tiger does't seem to be in pain, but the videos simply don't show enough to make any real claims.
video length: (0:40)
Tiger's eye gets THOR LLLT / Low Level Laser Therapy treatment
video length: (0:39)
Original Source: https://www.youtube.com/watch?v=FB5AykoLngo
Grizzly Bear recieving LLLT for it's osteoarthritis of the hip.
video length: (0:54)
Action News reports on the use of LLLT for relief from Carpal Tunnel Syndrome. LLLT provides relief from pain and inflammation, migraines, arthritis, fibromyalgia, back pain, neck pain, muscle injuries, ligament injuries, and many more.
video length: (3:02)
Original Source: https://www.youtube.com/watch?v=bRe5U4sO4t4&nohtml5=False
Anna Johnson is the British 3 Day Olympic team equine physio. Here she demonstrates the THOR laser system for pain relief and tissue healing.
video length: (4:51)
Original Source: https://www.youtube.com/watch?v=hC5CTON4G4Q&nohtml5=False
In this video three physical therapists talk about using LLLT for pain management and for smoking cessation.
video length: (3:24)
Original Source: https://www.youtube.com/watch?v=mdGNAI5mMCA&nohtml5=False
This is essentially an ad for thor, and the physical therapy clinic mentioned, but it still contains a small amount of information on LLLT
video length: (2:00)
Original Source: https://www.youtube.com/watch?v=of1DKWTpcaA
LLLT also known as cold laser was featured on Channel 7 News with Dr Roberta Chow using low level laser to treat back pain
video length: (2:06)
Original Source: https://www.youtube.com/watch?v=GPk5HxzF_kY&nohtml5=False
This video shows North Dallas and Plano chiropractor, Dr. Khayal, demonstrating the use of cold laser therapy, sometimes known as "cold light laser". Premier Health Chiropractic employs cold laser therapy as a part of its patients healing and recovery process, along with other chiropractic technologies such as the ProAdjuster and spinal decompression.
video length: (2:02)
Original Source: https://www.youtube.com/watch?v=gpdY13Xazgc&nohtml5=False
Video of a LLLT procedure on a dental pateint.
video length: (1:56)
Original Source: https://www.youtube.com/watch?v=RrJCCnsqN1w
Fox News 10 reports on the Microlight ML830® Cold Laser used for all types of pain relief.
video length: (4:58)
Dr. Sam Lam talks about a laser therapy device for hairloss, it is basically an ad, so be mindful of that.
video length: (3:25)
Original Source: https://www.youtube.com/watch?v=7u6wwHCBlbQ
this video talks about the benificial effects of LLLT on all cells that are injured or ailing:
- Brain cells
- Skin cells
- Bone cells
- Nerve cells
It also states that LLLT has no effect on cells that don't need energy.
video length: (7:26)
Original Source: https://www.youtube.com/watch?v=KUJinXH5tr4
Lasers as a medicinal tool have been researched ever since their discovery forty years ago. LASER is the acronym for Light Amplification by Stimulated Emission of Radiation. Albert Einstein was the first person to discover the presence of laser; however it was Theodre Maiman who invented the first working ruby laser. He managed to produce a red colored laser from ruby crystal which was so intense that it could bore through several layers of stacked razor metals. The laser produced was powerful but short-lived. Since then much research has taken place in this area.
Low level lasers are characterized by low intensity levels and were used by Endre Mester, a Hungarian scientist in his medical research and he presented the paper on utility of Low level lasers in medicine in 1969. This resulted in astounding discoveries -- laser beams relieved patients from pain, hastened recuperation, and drastically cut down marks and blemishes.
LLLT- The Science behind It
The photons, carriers of electromagnetic radiations, an inherent component of all wavelengths of light activate the multifunctional nucleotide, ATP. ATP (Adenosine Triphosphate) contain high energy phosphate bonds which transport energy to cells for biochemical processes including muscular contraction and enzymatic metabolism, thereby restoring the normal enzymatic balance and energy levels. This, in a radical but natural manner, accelerates the healing process.
LLLT is characterized by typical LASER attributes of coherence, polarization and monochromaticity. They are narrow and shiny beams which can penetrate and be easily assimilated by the body. Low level LASERs have a specific wavelength range. The frequency of light is given by the movement of light moving upward and downward.
How It Works
Low level laser therapy works in a similar manner to the photosynthesis in plants where the sun's energy is used by the plants which initiate crucial cellular processes hastening the cell production and rejuvenating processes of the plant cells.
In the similar way, the photons of LLT reach the human body. While the body can be compared to the plant, the low level laser light is similar to the sun light. Once absorbed, the LASER activates the cell metabolism and cell reconstruction. The Low Level Laser Therapy rays are capable of boring 3 inches deep into the body. These rays insert bio photons into the damaged and the living cells. These cells start producing ATP improving their function, strengthening the body resistance by producing collagen, enzymes thereby improving the synthesis of various hormones. These substances are basic for the healthy functioning of the body cells. Hence the tissues are healed and pain disappears.
With photons as the driving force, the Low Level Laser is the silent healer of wounds, pains and dermatological disorders. It is established beyond doubt that unlike other drug or therapy, Low Level Laser Therapy has no peripheral or undesirable secondary effect. A laser is critical in revitalizing the impaired or injured cells by improving the resistance or immunity. Low Level Laser Therapy will go a long way in medical history and it has come to a stay.
video length: (4:00)
Original Source: https://www.youtube.com/watch?v=v9fHMR94t_I
Advertisement that at least shows LLLT being used on patients.
video length: (2:09)
This video is not exactly the autority on LLLT, it does show some results in the use of LLLT in hairloss at (6:24); however it has a shameless hairloss clinic plug at the end, so take it with a grain of salt.
video length: (7:55)
Original Source: https://www.youtube.com/watch?v=bm4KhRTsUlY
This tool is a searchable collection of technical publications, books, videos and other resources about the use of lasers and light for PhotoBioModulation (PBM). Enter a keyword above or see some of our favorite queries below.
Here are some of our favorite queries:
- Information for Beginners
- Best wavelength for PBM (980nm vs. 810nm vs 660nm...)
- Compare Lasers and LEDs
- Pulsing versus Continuous Wave (CW)
- Dosage: The best practices for dosage
- How NOT to promote laser therapy (by Turner and Hode)
- Great summary of positive double blind studies
- Whole Body Systems
- See all videos
- See all books about laser therapy and cold lasers
- Testimonials
- Amazing results
- Video testimonials from patients
- Video testimonials from doctors
- Incredible results in animals
- Increasing Athletic Performance
- Research Info for other Applications
- Stem cell production in laser therapy
- Cosmetic and skin therapy parameters
- Intro to laser acupuncture
- Traumatic brain injury research
- Soft Tissue
- Autoimmune
- Lyme's Disease
- Parkinson's research
- Alzheimer's research
- Hashimoto's research
- Covid
- Contraindications
- LLLT and Cancer
All the resources include links to the original source so we are not making any statement about the use of lasers for treating non-FDA cleared application, we are simple summarizing what others have said.
Where every possible, we have included a link to the orginal publication.
This tool uses a broad match query so:
- It does not correct spelling and searches only cold laser related subjects so do not use LLLT, cold or laser in the search bar
- It works better with shorter search terms or even parts of search terms
- It searches all the available fields so you can enter a body part, author, condition or laser brand.
- Where ever possible, the detailed section about the resource will link to the sources.
- This system is only for photobiomodulation or cold laser therapy research (including LLLT, laser acupuncture and high power laser therapy) only. It does NOT include photodynamic laser therapy (where the laser is used to react with a pharmaceutical), hot surgery lasers or cosmetic lasers. It does include some resources on weight loss and smoking cessation.
The results of the search are sorted based on 3 quality factors on a scale of 1 to 10 with 10 being the best score. Originally all the resources were given a 5-5-5 until they could be individually evaluated. These scores are purely opinion and are only used to simplify the rank of the results from more valuable to least valuable. This should not be considered a critique of any work. This system was created to help researchers (including ourselves) find the most usable resources for any cold laser therapy research. The resources are assigned values based on the following 3 factors:
- Efficacy: The resource (especially research papers) should show a significant improvement in the condition being treated. Resources that show better results are given a higher quality score.
- Detail: The source must give enough information that the results can be duplicated. If a resource lacks too many details that it cannot be recreated, it is given a lower detail score.
- Lack of Bias: Many resources are created to try and show that one device is superior to its competition. Many manufacturers have staff that crank out biased papers on a regular basis on the hope that this will make their product look superior. If the author of the resource is paid by a manufacturer of the resource appears to be biased towards one device and not one technology, the resource has much less value.
Over the past few years of working with research, we found that a majority of the published resources are lacking in one of these three ranking factors.
The original goal of this research tool was to tie published resources to the protocols in the laser-therapy.us library. This connection allows users to trace each protocol back to a list of resources so the protocol can be researched and improved.
General Comments
POWER
When many of the first research papers were published, the most power laser available for therapy were less than 100mW and many systems had to be pulsed to keep the laser from burning out too quickly. Today, system are available that will deliver up to 60,000mW of continuous output. Because of these power limitation, many early studies were limited to extremely low dosages by today’s standards. It takes a 50mW system 17 minutes to deliver 50 joules at the surface of the skin. If this was spread over a large area of damage or was treating a deeper problem, the actual dosages were much less than 1J/cm2. Today, we know that these dosages typically produce very little or no results.
WAVELENGTH
About 80% of the resources in this database are in the near infrared wavelength. There is also some interest in the red wavelength (600 to 660nm) . Other wavelengths like blue, purple, and green have very little scientific research behind them and have not gotten much traction in the core therapy market with the exception of some fringe consumer products.
Legal Disclaimer
This research tool is free to use but we make no claims about the accuracy of the information. It is an aggregation of existing published resources and it is up to the user to determine if the source of the resources has any value. The information provided through this web site should not be used for diagnosing or treating a health problem or disease. If you have or suspect you may have a health problem, you should consult your local health care provider.
Welcome to the BioPhotonica Education Center. There are over 5000 successful studies showing the efficacy of PBM, light therapy and sound therapy. This is a searchable collection of technical publications, books, videos and other resources about the best practices in the industry and about treating a wide variety of problems. All the resources include links to the original source (where available) so we are not making any claims about the use of our technology for treating "non-FDA cleared" applications, we are simply summarizing what the expert are saying about proper application of these technologies.
Enter a keyword above and click on one of the following links to see a set of publications about that subject. HINT: Shorter keywords work better.
Here are some of our favorite queries:
- Whole Body Systems
- Treating Post Covid with PBMT
- Info for beginners (See several graphic representation of the PBM chemical process)
- Best wavelength for light therapy (980nm vs. 810nm vs 660nm...)
- Pulsing Versus continuous wave
- Dosage: Searching for the best practices for dosage
- Great summary of positive double blind studies
Testimonials
- Amazing results
- Video testimonials from patients
- Video testimonials from doctors
- Incredible results in animals
- Increasing athletic performance
Research Info for other Applications
- Stem cell production in laser therapy
- Cosmetic and skin therapy parameters
- Laser acupuncture
- Traumatic Brain Injury (TBI)
- Soft Tissue Injury
- Fertility and Reproductive Health
Autoimmune Research
Contraindications
This tool uses a broad match query so:
- It does not correct spelling and searches only PBM related subjects so do not use LLLT, cold or laser in the search bar
- It works better with shorter search terms or even parts of search terms
- It searches all the available fields so you can enter a body part, author, condition or laser brand.
- This system is only for photobiomodulation or cold laser therapy research (including LLLT, laser acupuncture and high power laser therapy) only. It does NOT include photodynamic laser therapy (where the laser is used to react with a pharmaceutical), hot surgery lasers or cosmetic therapies.
Welcome to the Lighthouse Health Education Center. There are over 5000 successful studies showing the efficacy of PBM, light therapy and sound therapy. This is a searchable collection of technical publications, books, videos and other resources about the best practices in the industry and about treating a wide variety of problems. All the resources include links to the original source (where available) so we are not making any claims about the use of our technology for treating "non-FDA cleared" applications, we are simply summarizing what the expert are saying about proper application of these technologies.
Enter a keyword above and click on one of the following links to see a set of publications about that subject. HINT: Shorter keywords work better.
Here are some of our favorite queries:
- Whole Body Systems
- Treating Post Covid with PBMT
- Info for beginners (See several graphic representation of the PBM chemical process)
- Best wavelength for light therapy (980nm vs. 810nm vs 660nm...)
- Pulsing Versus continuous wave
- Dosage: Searching for the best practices for dosage
- Great summary of positive double blind studies
Testimonials
- Amazing results
- Video testimonials from patients
- Video testimonials from doctors
- Incredible results in animals
- Increasing athletic performance
Research Info for other Applications
- Stem cell production in laser therapy
- Cosmetic and skin therapy parameters
- Laser acupuncture
- Traumatic Brain Injury (TBI)
- Soft Tissue Injury
Autoimmune Research
Contraindications
This tool uses a broad match query so:
- It does not correct spelling and searches only cold laser related subjects so do not use LLLT, cold or laser in the search bar
- It works better with shorter search terms or even parts of search terms
- It searches all the available fields so you can enter a body part, author, condition or laser brand.
- This system is only for photobiomodulation or cold laser therapy research (including LLLT, laser acupuncture and high power laser therapy) only. It does NOT include photodynamic laser therapy (where the laser is used to react with a pharmaceutical), hot surgery lasers or cosmetic therapies.